Look online to collect some univariate data. For example, you might collect data on the number...
Look online to collect some univariate data. For example, you might collect data on the number of HRs hit by the top Major league players, the population for each of the fifty US states, the average SAT scores for all colleges in the Big Ten, or the number of animals at the twenty largest US zoos. Once you do that, please do the following:
- Discuss where you located your data (website, etc.) (1 point)
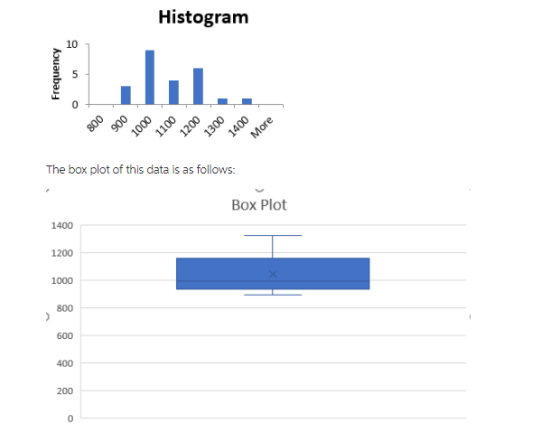
- Organize your data using at least two of the methods we discussed in class (pie chart, bar graph, histogram, dotplot, stem-and-leaf plot, boxplot – but don’t use pie chart and bar graph as your two, since you won’t be able to see shape using just those) (4 points)
- Describe the shape of your data; make sure to include some of the following concepts – modality, symmetry, and skewness (1 points)
- Calculate the most appropriate measure of center and spread (2 points)
- Defend your choices as to which were the most appropriate measure of center and spread (2 points)
- Interpret these charts and statistics in context (2 points)
Homework Answers


Add Answer to:
Look online to collect some univariate data. For example, you
might collect data on the number...
14) Explain why the following bar graph is misleading and how you would fix it. (Hint:...
 14) Explain why the following bar graph is misleading and how you would fix it. (Hint: Section. 2.3 #25) 3.00 52.50 $2 00 $1 50 51 08 MILK 51 00 0 10 Fal 2011 11) Histograms are very important to identify the 'shape' of a quantitative dataset. 4 A) Which histogram would be described as fairly bell-shaped? B) Which histogram would be described as fairly uniform? C) Which histogram would be described as skewed to the right or skewed positively?...
L. Collect data from several fast food chains on the number of fat calories and grams of saturated fat in menu ite...
 L. Collect data from several fast food chains on the number of fat calories and grams of saturated fat in menu items. Record at least 12 ordered pairs of (fat calories, grams of saturated fat) Organize your data in a table. Il. Make a scatter plot of the data on graph paper. Be sure to label the axes and use an appropriate title for the graph. You may wish to use a graphing calculator, spread sheet, or other technology resource...
Unit 6 Lesson 3 Classwork (Adapted from Math Vision Project) Data Distribution A lot of information...
 Unit 6 Lesson 3 Classwork (Adapted from Math Vision Project) Data Distribution A lot of information can be obtained from looking at data plots and their distributions. It is important when describing data that we use context to communicate the shape, center, and spread. Shape and spread: Modes: uniform (evenly spread- no obvious mode), unimodal (one main peak), bimodal (two main peaks), or multimodal (multiple locations where the data is relatively higher than others). Skewed distribution: when most data is...
In this project, you will work with sales data from Top’t Corn, a popcorn company with...
In this project, you will work with sales data from Top’t Corn, a popcorn company with an online store, multiple food trucks, and two retail stores. You will begin by inserting a new worksheet and entering sales data for the four food truck locations, formatting the data, and calculating totals. You will create a pie chart to represent the total units sold by location and a column chart to represent sales by popcorn type. You will format the charts, and...
Review pages 0.3 and 0.4 in the online notes if you are not familiar with using...
Review pages 0.3 and 0.4 in the online notes if you are not familiar with using the equation editors in Word and Canvas. 1. Use the Word Equation Editor to complete the following formulas using the correct symbols here. [10 points] A. Sample standard deviation s= B. z score in a sample z= 2. Go to the discussion board titled “Lab Question 2” and post the formulas for a sample standard deviation and for a z score in a...
Due Since Yesterday, need it ASAP please! Data is there already. if you can't do it...
 Due Since Yesterday, need it ASAP please!
Data is there already. if you can't do it don't mess
with it. You asked the same thing yesterday.
We were unable to transcribe this imageWe were unable to transcribe this imageWe were unable to transcribe this imageFATHER MOTHER FIRST SO 68.0 70.0 64.0 71.0 65.5 720 69.0 63.5 69.5 66.0 71.0 72.0 70.0 58.0 65.5 60.0 68.0 67.0 65.0 65.0 71.0 63.0 71.0 67.0 65.5 70,0 68.0 63.0 70.5 62.0 66.0 64.0...
Due Since Yesterday, need it ASAP please!
Data is there already. if you can't do it don't mess
with it. You asked the same thing yesterday.
We were unable to transcribe this imageWe were unable to transcribe this imageWe were unable to transcribe this imageFATHER MOTHER FIRST SO 68.0 70.0 64.0 71.0 65.5 720 69.0 63.5 69.5 66.0 71.0 72.0 70.0 58.0 65.5 60.0 68.0 67.0 65.0 65.0 71.0 63.0 71.0 67.0 65.5 70,0 68.0 63.0 70.5 62.0 66.0 64.0...
MAT 107 Project: Age of Students in College Professor Sumner Collect Data: (5 points) You will need to ask 30 college students their age. The students can attend any college or university. Use the tab...
MAT 107 Project: Age of Students in College Professor Sumner Collect Data: (5 points) You will need to ask 30 college students their age. The students can attend any college or university. Use the table below to input the data you collected. If you do the work for this project by hand, you must show the work you do to arrive at your results to earn full credit. If you use technology (computer, calculator, etc.) to obtain the results, you...
please help! I think I got some of the parts answered but I don't know! TATS...
 please help! I think I got some of the parts answered
but I don't know!
TATS lessen 2 Saved to this PC References MailingsReview View Help Tell me what you want to do AaBbCcD AaBbCcD AaBbC AaBbCcl A Normal No Spac... Heading 1 Heading 2 Styles 1. The expected life expectancy for a sample of 6 dog breeds was collected. Breed Collie Cockapoo Dachshund Life Expectancy 18 12 English Bulldog 10 Pointer Malamute 13 A. By hand, calculate the mean...
please help! I think I got some of the parts answered
but I don't know!
TATS lessen 2 Saved to this PC References MailingsReview View Help Tell me what you want to do AaBbCcD AaBbCcD AaBbC AaBbCcl A Normal No Spac... Heading 1 Heading 2 Styles 1. The expected life expectancy for a sample of 6 dog breeds was collected. Breed Collie Cockapoo Dachshund Life Expectancy 18 12 English Bulldog 10 Pointer Malamute 13 A. By hand, calculate the mean...
What does the five number tell us about the time spent on email (Hint, interpret the...
 What does the five number tell us about the time spent on email
(Hint, interpret the five number summary in plain English) and what
does the Boxplot and the normality test show? Explain.
Use the 1.5xIQR rule to identify possible outliers. List the
cutoff points for outliers, Show your workings. Explain what you
found out. (Hint: Are there any excessive time spent on email for
Male(1) or Female(2) or both).
GET DATA /TYPE-XLS /FILE='C: \Users\rmanda 1 \ Desktop\homework! . xls'...
What does the five number tell us about the time spent on email
(Hint, interpret the five number summary in plain English) and what
does the Boxplot and the normality test show? Explain.
Use the 1.5xIQR rule to identify possible outliers. List the
cutoff points for outliers, Show your workings. Explain what you
found out. (Hint: Are there any excessive time spent on email for
Male(1) or Female(2) or both).
GET DATA /TYPE-XLS /FILE='C: \Users\rmanda 1 \ Desktop\homework! . xls'...
DISPLAYING AND DESCRIBING DISTRIBUTIONS In this lab assignment you will use descriptive and graphical tools in...
 DISPLAYING AND DESCRIBING DISTRIBUTIONS In this lab assignment you will use descriptive and graphical tools in StatCrunch to analyze and interpret data related to the passengers of the British ocean liner Titanic that sank in 1912 after colliding with an iceberg. In particular, you will explore the relationship between age, gender, social status and survival of 1309 passengers. You will learn how to display the related categorical and quantitative data with bar charts, histograms, and boxplots, and how to summarize...
 14) Explain why the following bar graph is misleading and how you would fix it. (Hint: Section. 2.3 #25) 3.00 52.50 $2 00 $1 50 51 08 MILK 51 00 0 10 Fal 2011 11) Histograms are very important to identify the 'shape' of a quantitative dataset. 4 A) Which histogram would be described as fairly bell-shaped? B) Which histogram would be described as fairly uniform? C) Which histogram would be described as skewed to the right or skewed positively?...
 L. Collect data from several fast food chains on the number of fat calories and grams of saturated fat in menu items. Record at least 12 ordered pairs of (fat calories, grams of saturated fat) Organize your data in a table. Il. Make a scatter plot of the data on graph paper. Be sure to label the axes and use an appropriate title for the graph. You may wish to use a graphing calculator, spread sheet, or other technology resource...
 Unit 6 Lesson 3 Classwork (Adapted from Math Vision Project) Data Distribution A lot of information can be obtained from looking at data plots and their distributions. It is important when describing data that we use context to communicate the shape, center, and spread. Shape and spread: Modes: uniform (evenly spread- no obvious mode), unimodal (one main peak), bimodal (two main peaks), or multimodal (multiple locations where the data is relatively higher than others). Skewed distribution: when most data is...
 Due Since Yesterday, need it ASAP please!
Data is there already. if you can't do it don't mess
with it. You asked the same thing yesterday.
We were unable to transcribe this imageWe were unable to transcribe this imageWe were unable to transcribe this imageFATHER MOTHER FIRST SO 68.0 70.0 64.0 71.0 65.5 720 69.0 63.5 69.5 66.0 71.0 72.0 70.0 58.0 65.5 60.0 68.0 67.0 65.0 65.0 71.0 63.0 71.0 67.0 65.5 70,0 68.0 63.0 70.5 62.0 66.0 64.0...
Due Since Yesterday, need it ASAP please!
Data is there already. if you can't do it don't mess
with it. You asked the same thing yesterday.
We were unable to transcribe this imageWe were unable to transcribe this imageWe were unable to transcribe this imageFATHER MOTHER FIRST SO 68.0 70.0 64.0 71.0 65.5 720 69.0 63.5 69.5 66.0 71.0 72.0 70.0 58.0 65.5 60.0 68.0 67.0 65.0 65.0 71.0 63.0 71.0 67.0 65.5 70,0 68.0 63.0 70.5 62.0 66.0 64.0...
 please help! I think I got some of the parts answered
but I don't know!
TATS lessen 2 Saved to this PC References MailingsReview View Help Tell me what you want to do AaBbCcD AaBbCcD AaBbC AaBbCcl A Normal No Spac... Heading 1 Heading 2 Styles 1. The expected life expectancy for a sample of 6 dog breeds was collected. Breed Collie Cockapoo Dachshund Life Expectancy 18 12 English Bulldog 10 Pointer Malamute 13 A. By hand, calculate the mean...
please help! I think I got some of the parts answered
but I don't know!
TATS lessen 2 Saved to this PC References MailingsReview View Help Tell me what you want to do AaBbCcD AaBbCcD AaBbC AaBbCcl A Normal No Spac... Heading 1 Heading 2 Styles 1. The expected life expectancy for a sample of 6 dog breeds was collected. Breed Collie Cockapoo Dachshund Life Expectancy 18 12 English Bulldog 10 Pointer Malamute 13 A. By hand, calculate the mean...
 What does the five number tell us about the time spent on email
(Hint, interpret the five number summary in plain English) and what
does the Boxplot and the normality test show? Explain.
Use the 1.5xIQR rule to identify possible outliers. List the
cutoff points for outliers, Show your workings. Explain what you
found out. (Hint: Are there any excessive time spent on email for
Male(1) or Female(2) or both).
GET DATA /TYPE-XLS /FILE='C: \Users\rmanda 1 \ Desktop\homework! . xls'...
What does the five number tell us about the time spent on email
(Hint, interpret the five number summary in plain English) and what
does the Boxplot and the normality test show? Explain.
Use the 1.5xIQR rule to identify possible outliers. List the
cutoff points for outliers, Show your workings. Explain what you
found out. (Hint: Are there any excessive time spent on email for
Male(1) or Female(2) or both).
GET DATA /TYPE-XLS /FILE='C: \Users\rmanda 1 \ Desktop\homework! . xls'...
 DISPLAYING AND DESCRIBING DISTRIBUTIONS In this lab assignment you will use descriptive and graphical tools in StatCrunch to analyze and interpret data related to the passengers of the British ocean liner Titanic that sank in 1912 after colliding with an iceberg. In particular, you will explore the relationship between age, gender, social status and survival of 1309 passengers. You will learn how to display the related categorical and quantitative data with bar charts, histograms, and boxplots, and how to summarize...
Most questions answered within 3 hours.
-
*****DO NOT ANSWER THIS QUESTION IF YOU DON'T
KNOW*******Rights and Duties of Auditors; Minimum 4000
words...
asked 28 minutes ago -
The probability that Janie is wearing sunglasses is 1/4. The
probability that she is wearing sunglasses...
asked 57 minutes ago -
Do you believe social media is more of a help or a hindrance in
controlling crises...
asked 1 hour ago -
Two long, parallel wires separated by 2.85 cm carry currents in
opposite directions. The current in...
asked 54 minutes ago -
Question # 1. Develop a list of rehabilitation journals
that publish articles concerning career counseling for...
asked 1 hour ago -
Bryant Company has a factory machine with a book value of
$85,100 and a remaining useful...
asked 1 hour ago -
What is the default classification for federal tax purposes of a
U.S. eligible entity with one...
asked 1 hour ago -
1. How many grams would 4.0x10²¹ atoms of calcium
weigh?
2.. Calculate the percent oxygen in...
asked 1 hour ago -
Balance Equation
K2Cr2O7 + H2C2O4 2H2O 6 K[Cr(C2O4 )2 (H2O)2 ]2H2O + CO2 +
H2O
asked 1 hour ago -
Select a position in the clinical laboratory and write an
appropriate job description and corresponding work...
asked 1 hour ago -
Targeting the Bottom of the Pyramid
What are some of the broader societal pricing concerns faced...
asked 1 hour ago -
Which of the following statements is correct? (3 marks)
a) Upon the public announcement of finding...
asked 1 hour ago