
Homework Answers
Add Answer to:
Use the given graph to estimate the left Riemann sum for the given interval with the...
Use the given graph to estimate the left Riemann sum for the given interval with the stated numbe...
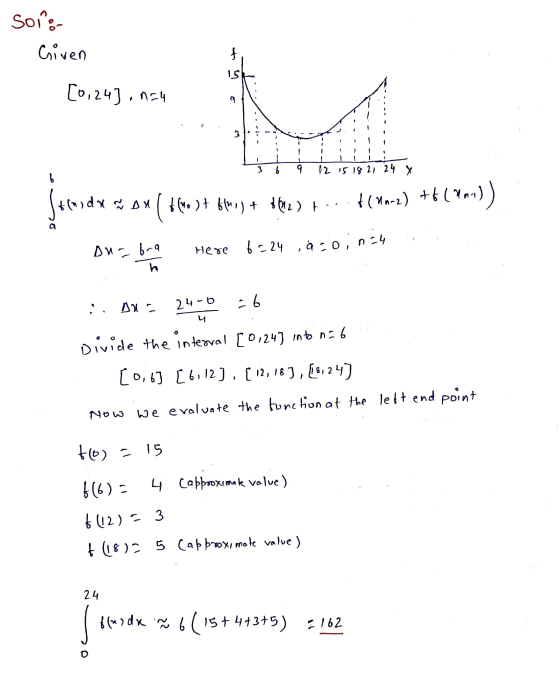
 Use the given graph to estimate the left Riemann sum for the given interval with the stated number of subdivisions. HINT [See Example 3.] (Round your answer to the nearest integer.) [0, 241, n = 4 20 12 15 21 3
Use the given graph to estimate the left Riemann sum for the given interval with the stated number of subdivisions. HINT [See Example 3.] (Round your answer to the nearest integer.) [0, 241, n = 4 20 12 15...
Use the given graph to estimate the left Riemann sum for the given interval with the stated number of subdivisions. HINT [See Example 3.] (Round your answer to the nearest integer.) [0, 241, n = 4 20 12 15 21 3
Use the given graph to estimate the left Riemann sum for the given interval with the stated number of subdivisions. HINT [See Example 3.] (Round your answer to the nearest integer.) [0, 241, n = 4 20 12 15...
4. [0/20 Points] DETAILS PREVIOUS ANSWERS WANEFMAC7 13.3.012.NVA MY NOTES Use the given graph to estimate...
 4. [0/20 Points] DETAILS PREVIOUS ANSWERS WANEFMAC7 13.3.012.NVA MY NOTES Use the given graph to estimate the left Riemann sum for the given interval with the stated number of subdivisions. HINT (See Example 3.] (Round your answer to the nearest integer.) [0, 16), n = 4 15 2 6 10 14 Need Help? Watch It Talk to a Tutor Submit Answer
Calculate the left Riemann sum for the given function over the given interval, using the given...
 Calculate the left Riemann sum for the given function over the given interval, using the given value of n. (When rounding, round your answer to four decimal places. places.) HINT [See Example 2.] f(x) = 27x2 over [-2, 2], n = 4 Need Help? Read It Watch It Talk to a Tutor -/1 points WANEAC7 6.3.007.MI. Calculate the left Riemann sum for the given function over the given interval, using the given value of n. (When rounding, round answers to...
Use the given graph of f on the interval [1, 7] to estimate the Riemann sum...
 Use
the given graph of f on the interval [1, 7] to estimate the Riemann
sum with three subintervals . Use left endpoints as the sample
points . Estimate all f(x) values to 1 decimal place, if necessary
. Show work
YA 11 0 1 T
Use
the given graph of f on the interval [1, 7] to estimate the Riemann
sum with three subintervals . Use left endpoints as the sample
points . Estimate all f(x) values to 1 decimal place, if necessary
. Show work
YA 11 0 1 T
Calculate the left Riemann sum for the given function over the given interval, using the given...
 Calculate the left Riemann sum for the given function over the given interval, using the given value of n. (When rounding, round your answer to four decimal places. If using the tabular method, values of the function in the table should be accurate to at least five decimal places.) HINT (See Example 2.) (x) = x over (1,5), n = 4 Enter an exact number. Need Help? Read Tato Tutor
Calculate the left Riemann sum for the given function over the given interval, using the given...
 Calculate the left Riemann sum for the given function over the given interval, using the given value of n. (When rounding, round your answer to four decimal places. If using the tabular method, values of the function in the table should be accurate to at least five decimal places.) HINT [See Example 2.] f(x) = 32 - 96x over [-1, 1], n = 4 Need Help? Read It Talk to a Tutor
Use the figures to calculate the left and right Riemann sums for f on the given...
 Use the figures to calculate the left and right Riemann sums for f on the given interval and the given value of n. 3 f(x) = + 1 on (1,5), n=4 0 1 2 3 0 1 2 3 4 5 The left Riemann sum fortis (Round to two decimal places as needed.) The right Riemann sum forf is (Round to two decimal places as needed.)
22 (1 point) a) The rectangles in the graph below illustrate a left endpoint Riemann sum...
 22 (1 point) a) The rectangles in the graph below illustrate a left endpoint Riemann sum for f(x) on the interval (2,6]. 9 The value of this Riemann sum is and this Riemann sum is an underestimate of the area of the region enclosed by y = f(x), the x-axis, and the vertical lines x = 2 and x = 6. y 8 7 6 5 4 3 2 1 X 1 2 3 4 5 6 7 8 Left...
by middle Riemann sum please~ not right and left ~Thank you 4-2 on the interval [-1,2],...
 by
middle Riemann sum please~ not right and left ~Thank you
4-2 on the interval [-1,2], and approximate [12] 1. (a) Sketch the graph of f(x) the area between the graph and the z-axis on [-1,2] by the left Riemann sum Ls using partitioning of the interval into 3 subintervals of equal length. b) For the same f(z) 4-12, write in sigma notation the formula for the left Riemann sum Ln with partitioning of the interval [-1,2 into n subintervals...
by
middle Riemann sum please~ not right and left ~Thank you
4-2 on the interval [-1,2], and approximate [12] 1. (a) Sketch the graph of f(x) the area between the graph and the z-axis on [-1,2] by the left Riemann sum Ls using partitioning of the interval into 3 subintervals of equal length. b) For the same f(z) 4-12, write in sigma notation the formula for the left Riemann sum Ln with partitioning of the interval [-1,2 into n subintervals...
Use a Riemann sum to approximate the area under the graph of f(x) = x2 on...
 Use a Riemann sum to approximate the area under the graph of f(x) = x2 on the interval 25x54 using n = 5 subintervals with the selected points as the left end points. The area is approximately (Type an integer or a decimal.)
 Use the given graph to estimate the left Riemann sum for the given interval with the stated number of subdivisions. HINT [See Example 3.] (Round your answer to the nearest integer.) [0, 241, n = 4 20 12 15 21 3
Use the given graph to estimate the left Riemann sum for the given interval with the stated number of subdivisions. HINT [See Example 3.] (Round your answer to the nearest integer.) [0, 241, n = 4 20 12 15...
Use the given graph to estimate the left Riemann sum for the given interval with the stated number of subdivisions. HINT [See Example 3.] (Round your answer to the nearest integer.) [0, 241, n = 4 20 12 15 21 3
Use the given graph to estimate the left Riemann sum for the given interval with the stated number of subdivisions. HINT [See Example 3.] (Round your answer to the nearest integer.) [0, 241, n = 4 20 12 15...
 4. [0/20 Points] DETAILS PREVIOUS ANSWERS WANEFMAC7 13.3.012.NVA MY NOTES Use the given graph to estimate the left Riemann sum for the given interval with the stated number of subdivisions. HINT (See Example 3.] (Round your answer to the nearest integer.) [0, 16), n = 4 15 2 6 10 14 Need Help? Watch It Talk to a Tutor Submit Answer
 Calculate the left Riemann sum for the given function over the given interval, using the given value of n. (When rounding, round your answer to four decimal places. places.) HINT [See Example 2.] f(x) = 27x2 over [-2, 2], n = 4 Need Help? Read It Watch It Talk to a Tutor -/1 points WANEAC7 6.3.007.MI. Calculate the left Riemann sum for the given function over the given interval, using the given value of n. (When rounding, round answers to...
 Use
the given graph of f on the interval [1, 7] to estimate the Riemann
sum with three subintervals . Use left endpoints as the sample
points . Estimate all f(x) values to 1 decimal place, if necessary
. Show work
YA 11 0 1 T
Use
the given graph of f on the interval [1, 7] to estimate the Riemann
sum with three subintervals . Use left endpoints as the sample
points . Estimate all f(x) values to 1 decimal place, if necessary
. Show work
YA 11 0 1 T
 Calculate the left Riemann sum for the given function over the given interval, using the given value of n. (When rounding, round your answer to four decimal places. If using the tabular method, values of the function in the table should be accurate to at least five decimal places.) HINT (See Example 2.) (x) = x over (1,5), n = 4 Enter an exact number. Need Help? Read Tato Tutor
 Calculate the left Riemann sum for the given function over the given interval, using the given value of n. (When rounding, round your answer to four decimal places. If using the tabular method, values of the function in the table should be accurate to at least five decimal places.) HINT [See Example 2.] f(x) = 32 - 96x over [-1, 1], n = 4 Need Help? Read It Talk to a Tutor
 Use the figures to calculate the left and right Riemann sums for f on the given interval and the given value of n. 3 f(x) = + 1 on (1,5), n=4 0 1 2 3 0 1 2 3 4 5 The left Riemann sum fortis (Round to two decimal places as needed.) The right Riemann sum forf is (Round to two decimal places as needed.)
 22 (1 point) a) The rectangles in the graph below illustrate a left endpoint Riemann sum for f(x) on the interval (2,6]. 9 The value of this Riemann sum is and this Riemann sum is an underestimate of the area of the region enclosed by y = f(x), the x-axis, and the vertical lines x = 2 and x = 6. y 8 7 6 5 4 3 2 1 X 1 2 3 4 5 6 7 8 Left...
 by
middle Riemann sum please~ not right and left ~Thank you
4-2 on the interval [-1,2], and approximate [12] 1. (a) Sketch the graph of f(x) the area between the graph and the z-axis on [-1,2] by the left Riemann sum Ls using partitioning of the interval into 3 subintervals of equal length. b) For the same f(z) 4-12, write in sigma notation the formula for the left Riemann sum Ln with partitioning of the interval [-1,2 into n subintervals...
by
middle Riemann sum please~ not right and left ~Thank you
4-2 on the interval [-1,2], and approximate [12] 1. (a) Sketch the graph of f(x) the area between the graph and the z-axis on [-1,2] by the left Riemann sum Ls using partitioning of the interval into 3 subintervals of equal length. b) For the same f(z) 4-12, write in sigma notation the formula for the left Riemann sum Ln with partitioning of the interval [-1,2 into n subintervals...
 Use a Riemann sum to approximate the area under the graph of f(x) = x2 on the interval 25x54 using n = 5 subintervals with the selected points as the left end points. The area is approximately (Type an integer or a decimal.)
Most questions answered within 3 hours.
-
Based on the range, which of the following sets of scores has
the greatest variability? 3,...
asked 14 seconds from now -
The extent to which assets are financed by borrowed funds and
other liabilities is indicated by:...
asked 57 minutes ago -
Explain in detail
Germany is the fifth largest economy
explain what goods and services Germany specializes...
asked 1 hour ago -
The density of platinum is 21.45 g/mL. If a cube of platinum
with a mass of...
asked 1 hour ago -
Accounts Receivable
Sales
A/R Posting
Extended Sales Invoice
Packing Slip
Compare invoice to packing slip 2...
asked 1 hour ago -
Michaella, age 23, is a full-time law student and is claimed by
her parents as a...
asked 1 hour ago -
Why are polymers not typically casted into products?
asked 1 hour ago -
When rolling a die 129 times, what is the probability of rolling
a 6 no more...
asked 1 hour ago -
4. A call option currently sells for $7.75. It has a strike
price of $85 and...
asked 1 hour ago -
1.
You need to prepare 10.0 liters of an acid aqueous solution with a
pH of...
asked 1 hour ago -
Along an aggregate supply curve, if the level of output is less
than the natural level...
asked 1 hour ago -
By 2025, annual consumption in emerging markets will total $30
trillion and contribute more than ________...
asked 1 hour ago