


Homework Answers
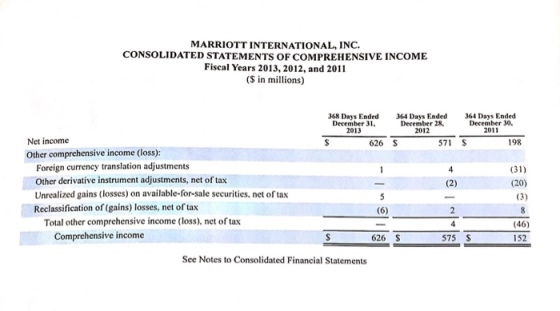
Liquidity
| Working Capital = | 1475-2773 = -1298 | ||||||
| Current Ratio= | 1475/2773 =0.53 | ||||||
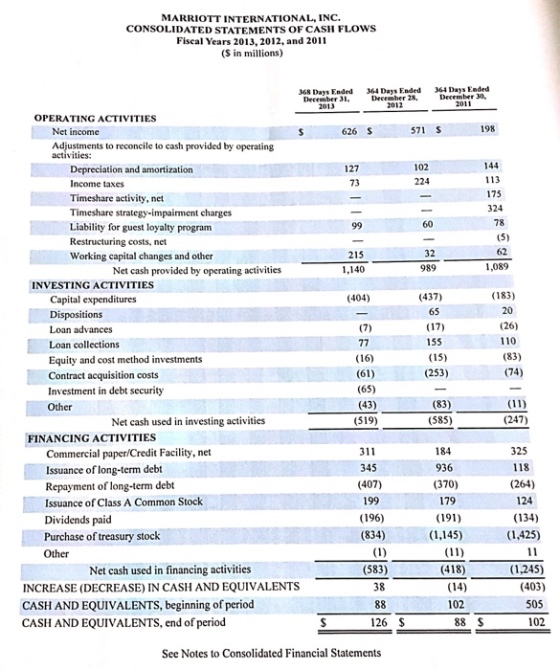
| Current cash debt coverge = | 989/2773 = 0.36 | ||||||
| Inventory Turnover= | Not Applicable- Inventory info not provided | ||||||
| Days in Inventory= | Not Applicable- Inventory info not provided | ||||||
| Accounts Receivable turnover= | 989/1028 =0.96 | ||||||
| Average Collection Period = | 365/0.96 =381 days | ||||||
Solvency
| Debt to assets Ratio = | 898/1989 =0.45 | |||
| Cash debt coverage = | 989/1989 =0.50 | |||
| Times Interest Earned = | 571+137+278/137 =7.19 | |||
| Free Cash Flow = | 989-437-191 =361 | |||
Profitability
| Earnings Per Share= | 571/322 =1.77 | ||||||
| Price Earnings Ratio = | Market price of share not given in question | ||||||
| Gross Profit rate = | 940/11814 =0.08 | ||||||
| Net Profit rate = | 571/11814 =0.05 | ||||||
Add Answer to:
Hi
need some help Calculating the Liquidity, solvency and
profitability of Marriott Intercontinental with the Financial...
Need help with below: Twenty metrics of liquidity, Solvency, and Profitability The comparative financial statements of...
Need help with below: Twenty metrics of liquidity, Solvency, and Profitability The comparative financial statements of Automotive Solutions Inc. are as follows. The market price of Automotive Solutions Inc. common stock was $119.70 on December 31, 20Y8. AUTOMOTIVE SOLUTIONS INC. Comparative Income Statement For the Years Ended December 31, 20Y8 and 20Y7 20Y8 20Y7 Sales $10,000,000 $ 9,400,000 Cost of goods sold (5,350,000) (4,950,000) Gross profit $ 4,650,000 $ 4,450,000 Selling expenses $ (2,000,000) $(1,880,000) Administrative expenses (1,500,000) (1,410,000) Total...
Twenty metrics of liquidity, Solvency, and Profitability The comparative financial statements of Automotive Solutions Inc. are...
Twenty metrics of liquidity, Solvency, and Profitability The comparative financial statements of Automotive Solutions Inc. are as follows. The market price of Automotive Solutions Inc. common stock was $58 on December 31, 20Y8. AUTOMOTIVE SOLUTIONS INC. Comparative Income Statement For the Years Ended December 31, 20Y8 and 20Y7 20Y8 20Y7 Sales $4,707,040 $4,336,800 Cost of goods sold (1,737,400) (1,598,410) Gross profit $2,969,640 $2,738,390 Selling expenses $(960,100) $(1,216,840) Administrative...
2021 was 50,000. Compute selected ratios, and compare liquidity, profitability, and solvency for two companies P15...
 2021 was 50,000. Compute selected ratios, and compare liquidity, profitability, and solvency for two companies P15.5 (LO 2) Selected financial data of Target (USA) and Wal-Mart Stores, Inc. (USA) for a recent year are presented below (in millions). Wal-Mart Target Stores, Inc. Corporation Income Statement Data for Year $476,294 358,069 91,353 $72,596 51,160 Net sales Cost of goods sold 16,816 Selling and administrative expenses Interest expense Other income (expense) Income tax expense 2,335 1,126 (410) 8,105 (391) 1,132 $ 16,022...
Twenty metrics of liquidity, Solvency, and Profitability The comparative financial statements of Automotive Solutions In...
Twenty metrics of liquidity, Solvency, and Profitability The comparative financial statements of Automotive Solutions Inc. are as follows. The market price of Automotive Solutions Inc. common stock was $65 on December 31, 20Y8. AUTOMOTIVE SOLUTIONS INC. Comparative Income Statement For the Years Ended December 31, 20Y8 and 20Y7 20Y8 20Y7 Sales $2,163,720 $1,993,570 Cost of goods sold (882,570) (811,960) Gross profit $1,281,150 $1,181,610 Selling expenses $(395,770) $(509,430) Administrative expenses (337,140) (299,190) Total operating expenses (732,910) (808,620) Operating income $548,240 $372,990...
Measures of liquidity, Solvency, and Profitability The comparative financial statements of Marshall Inc. are as follows....
 Measures of liquidity, Solvency, and Profitability
The comparative financial statements of Marshall Inc. are as
follows. The market price of Marshall common stock was $ 59 on
December 31, 20Y2
Determine the following measures for 20Y2, rounding to one
decimal place, except for dollar amounts, which should be rounded
to the nearest cent. Use the rounded answer of the requirement for
subsequent requirements, if required. Assume 365 days a year
see screenshots, please. I need help solving 4-18. Thanks
Measures...
Measures of liquidity, Solvency, and Profitability
The comparative financial statements of Marshall Inc. are as
follows. The market price of Marshall common stock was $ 59 on
December 31, 20Y2
Determine the following measures for 20Y2, rounding to one
decimal place, except for dollar amounts, which should be rounded
to the nearest cent. Use the rounded answer of the requirement for
subsequent requirements, if required. Assume 365 days a year
see screenshots, please. I need help solving 4-18. Thanks
Measures...
Measures of liquidity, Solvency, and Profitability The comparative financial statements of Marshall Inc. are as follows....
 Measures of liquidity, Solvency, and Profitability The comparative financial statements of Marshall Inc. are as follows. The market price of Marshall common stock was $ 65 on December 31, 20Y2. Marshall Inc. Comparative Retained Earnings Statement For the Years Ended December 31, 20Y2 and 20Y1 2012 20Y1 Retained earnings, January 1 $3,187,400 760,000 Net income $2,691,000 551,200 $3,242,200 Total $3,947,400 Dividends: On preferred stock $11,900 $11,900 On common stock 42,900 42,900 $54,800 Total dividends $54,800 $3,892,600 Retained earnings, December 31...
Twenty metrics of liquidity, Solvency, and Profitability The comparative financial statements of Automotive Solutions Inc. are...
Twenty metrics of liquidity, Solvency, and Profitability The comparative financial statements of Automotive Solutions Inc. are as follows. The market price of Automotive Solutions Inc. common stock was $60 on December 31, 20Y8. AUTOMOTIVE SOLUTIONS INC. Comparative Income Statement For the Years Ended December 31, 20Y8 and 20Y7 20Y8 20Y7 Sales $4,091,650 $3,769,800 Cost of goods sold (1,470,950) (1,353,270) Gross profit $2,620,700 $2,416,530 Selling expenses $(919,620) $(1,109,770) Administrative expenses (783,380) (651,770) Total operating expenses (1,703,000) (1,761,540) Operating income $917,700 $654,990...
Twenty metrics of liquidity, Solvency, and Profitability The comparative financial statements of Automotive Solutions Inc. are...
Twenty metrics of liquidity, Solvency, and Profitability The comparative financial statements of Automotive Solutions Inc. are as follows. The market price of Automotive Solutions Inc. common stock was $53 on December 31, 20Y8. AUTOMOTIVE SOLUTIONS INC. Comparative Income Statement For the Years Ended December 31, 20Y8 and 20Y7 20Y8 20Y7 Sales $1,248,300 $1,150,140 Cost of goods sold (429,240) (394,900) Gross profit $819,060 $755,240 Selling expenses $(285,370) $(345,520) Administrative expenses (243,090) (202,920) Total operating expenses (528,460) (548,440) Operating income $290,600 $206,800...
Twenty metrics of liquidity, Solvency, and Profitability The comparative financial statements of Automotive Solutions Inc. are...
Twenty metrics of liquidity, Solvency, and Profitability The comparative financial statements of Automotive Solutions Inc. are as follows. The market price of Automotive Solutions Inc. common stock was $59 on December 31, 20Y8. AUTOMOTIVE SOLUTIONS INC. Comparative Income Statement For the Years Ended December 31, 20Y8 and 20Y7 20Y8 20Y7 Sales $6,137,475 $5,654,750 Cost of goods sold (2,124,300) (1,954,360) Gross profit $4,013,175 $3,700,390 Selling expenses $(1,438,910) $(1,738,690) Administrative expenses (1,225,745) (1,021,140) Total operating expenses (2,664,655) (2,759,830) Operating income $1,348,520 $940,560...
Twenty metrics of liquidity, Solvency, and Profitability The comparative financial statements of Automotive Solutions Inc. are...
Twenty metrics of liquidity, Solvency, and Profitability The comparative financial statements of Automotive Solutions Inc. are as follows. The market price of Automotive Solutions Inc. common stock was $64 on December 31, 20Y8. AUTOMOTIVE SOLUTIONS INC. Comparative Income Statement For the Years Ended December 31, 20Y8 and 20Y7 20Y8 20Y7 Sales $3,048,480 $2,808,690 Cost of goods sold (1,095,000) (1,007,400) Gross profit $1,953,480 $1,801,290 Selling expenses $(702,710) $(838,590) Administrative expenses (598,600) (492,510) Total operating expenses (1,301,310) (1,331,100) Operating income $652,170 $470,190...
 2021 was 50,000. Compute selected ratios, and compare liquidity, profitability, and solvency for two companies P15.5 (LO 2) Selected financial data of Target (USA) and Wal-Mart Stores, Inc. (USA) for a recent year are presented below (in millions). Wal-Mart Target Stores, Inc. Corporation Income Statement Data for Year $476,294 358,069 91,353 $72,596 51,160 Net sales Cost of goods sold 16,816 Selling and administrative expenses Interest expense Other income (expense) Income tax expense 2,335 1,126 (410) 8,105 (391) 1,132 $ 16,022...
 Measures of liquidity, Solvency, and Profitability
The comparative financial statements of Marshall Inc. are as
follows. The market price of Marshall common stock was $ 59 on
December 31, 20Y2
Determine the following measures for 20Y2, rounding to one
decimal place, except for dollar amounts, which should be rounded
to the nearest cent. Use the rounded answer of the requirement for
subsequent requirements, if required. Assume 365 days a year
see screenshots, please. I need help solving 4-18. Thanks
Measures...
Measures of liquidity, Solvency, and Profitability
The comparative financial statements of Marshall Inc. are as
follows. The market price of Marshall common stock was $ 59 on
December 31, 20Y2
Determine the following measures for 20Y2, rounding to one
decimal place, except for dollar amounts, which should be rounded
to the nearest cent. Use the rounded answer of the requirement for
subsequent requirements, if required. Assume 365 days a year
see screenshots, please. I need help solving 4-18. Thanks
Measures...
 Measures of liquidity, Solvency, and Profitability The comparative financial statements of Marshall Inc. are as follows. The market price of Marshall common stock was $ 65 on December 31, 20Y2. Marshall Inc. Comparative Retained Earnings Statement For the Years Ended December 31, 20Y2 and 20Y1 2012 20Y1 Retained earnings, January 1 $3,187,400 760,000 Net income $2,691,000 551,200 $3,242,200 Total $3,947,400 Dividends: On preferred stock $11,900 $11,900 On common stock 42,900 42,900 $54,800 Total dividends $54,800 $3,892,600 Retained earnings, December 31...
Most questions answered within 3 hours.
-
A 0.035 mol sample of a weak acid, HA, is dissolved in 437 mL of
water...
asked 7 minutes ago -
a sample of Ar gas has a volume of 6.30 L with an unknown
pressure. the...
asked 8 minutes ago -
The
serum cholesterol levels of a population of kids follow a normal
distribution with mean 155...
asked 28 minutes ago -
han discusses the racist practice of badlands, a bar
in the Castro
district of San Francisco,...
asked 40 minutes ago -
A sample of final exam scores is normally distributed with a
mean equal to 25 and...
asked 43 minutes ago -
An investor shorts 100 shares of a stock when the share price is
$50 and closes...
asked 47 minutes ago -
LLOP corporation just paid 4$ dividend per share, you expect the
dividend to grow 8% for...
asked 56 minutes ago -
if we subtract 1000 from 0001 is there overflow? (binary)
asked 1 hour ago -
Hello, I need help with the function below, The language I am
using is Ocaml
open...
asked 1 hour ago -
Explain how the presence of glucose represses the gal structural
genes?
asked 1 hour ago -
For the reaction CaI2+2AgNO3⟶2AgI+Ca(NO3)2 how many grams of
silver iodide, AgI, are produced from 56.5 g...
asked 1 hour ago -
Write an equation for hydrolysis via acid catalysis.
Using ethyl acetate, ethyl benzoate, ethyl formate or...
asked 1 hour ago