
Homework Answers


Add Answer to:
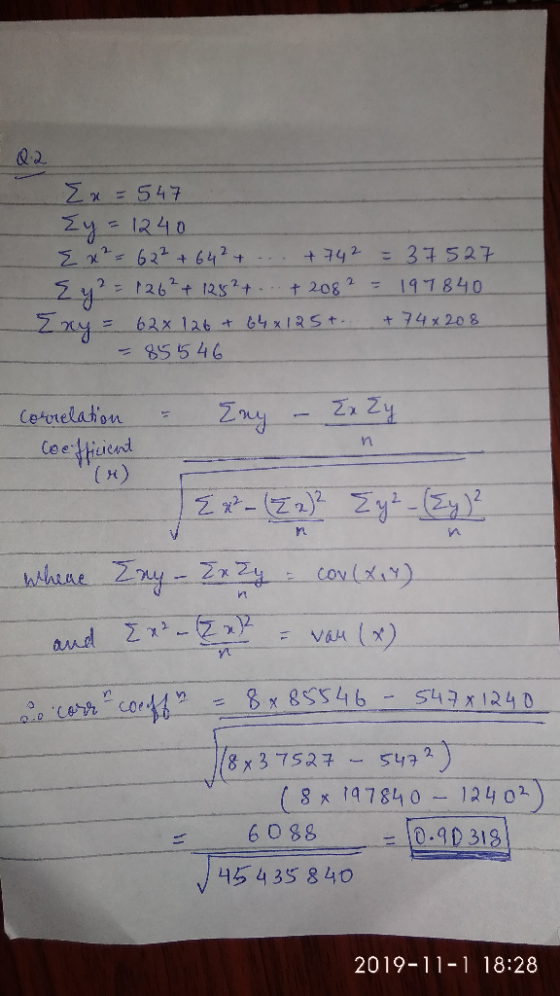
please answer the second one
2. Compute the coefficient of correlation between X and Y and...
11. A random sample of 72 guinea pigs was taken and injected with infcabious bacteria. Their...
 11. A random sample of 72 guinea pigs was taken and injected with infcabious bacteria. Their survival times are: 43, 45, 53, 56, 56, 57, 58, 66, 67, 73, 74, 79, 80, 80, 81, 81, 81, 82, 83, 83, 84, 88, 89, 91, 91, 92, 92, 97, 99, 99, 100, 100, 101, 102, 102, 102, 103, 104, 107, 108, 109, 113, 114, 118, 121, 123, 126, 128, 137, 138, 139, 144, 145, 147, 156, 162, 174, 178, 179, 184, 191,...
11. A random sample of 72 guinea pigs was taken and injected with infectious bacteria. Their...
 11. A random sample of 72 guinea pigs was taken and injected with infectious bacteria. Their survival times are: 43, 45, 53, 56, 56, 57, 58, 66, 67, 73, 74, 79, 80, 80, 81, 81, 81, 82, 83, 83, 84, 88, 89, 91, 91, 92, 92, 97, 99, 99, 100, 100, 101, 102, 102, 102, 103, 104, 107, 108, 109, 113, 114, 118, 121, 123, 126, 128, 137, 138, 139, 144, 145, 147, 156, 162, 174, 178, 179, 184, 191,...
The following data represent glucose blood levels (mg/100 ml) after a 12-hour fast for a random...
 The following data represent glucose blood levels (mg/100 ml) after a 12-hour fast for a random sample of 70 women (Reference American Journal of Clinical Nutrition, Vol. 19, pp. 345-351) 45 668) 71 75 64 59 59 75 82 B0 81 85 77 82 90 87 72 70 69 83 71 87 69 81 76 96 83 67 94 101 94 89 94 73 99 93 85 83 90 78 80 85 83 84 74 81 70 65 89 70...
Boys 111 107 100 The data to the left are IQ test scores for 47 seventh...
 Boys 111 107 100 The data to the left are IQ test scores for 47 seventh grade boys and 31 seventh grade girls from a Midwestern school district. 107 115 111 104 106 Do a test of hypothesis to see whether the mean test scores of the two groups are the same or different. Assume that the data represent a random sample from the population of 7th grade boys and girls from this school district. 113 109 113 128 128...
4 2. ONLY ANSWER QUESTION 3 According to the empirical rule, approximately what percentage of normally...
4 2. ONLY ANSWER QUESTION 3 According to the empirical rule, approximately what percentage of normally distributed data lies within one standard deviation of the mean? 3. The following random sample of 28 female basketball player heights, in inches, is: 63 71 69 65 73 84 70 69 67 74 75 68 65 63 67 69 68 72 73 75 72 75 73 68 69 74 65 65 What is the shape of the this box plot?
In a study to compare the IQ between boys and girls in a particular elementary school,...
In a study to compare the IQ between boys and girls in a particular elementary school, a random sample of seventh grade boys and girls was taken from Vancouver Hill Elementary School. The girls and boys were asked to take an IQ test and their scores were recorded. Some summary statistics of the IQs of the boys and girls is given below. Gender Number of children measured Average IQ Standard deviations of IQ Boys 17 107.1 5.6 Girls 15 105.5...
Thomas Carey, single, claiming one exemption, has cumulative eamings before this biweekly pay per...
 Thomas Carey, single, claiming one exemption, has cumulative eamings before this biweekly pay period of $125,800. If he Social Security is 6.2% on $127,200 and Medicare is 1.45% on all earnings. (Round to the nearest cent as needed.) 囲(Click the icon to view the Single Persons-Biweekly Payroll Period federal income tax withholding table. The amount of Thomas Carey's deduction for FIT is $ The amount of Thomas Carey's deduction for FICA (OASDI) is $ The amount of Thomas Carey's deduction...
Compute the correlation coefficient, r, for all five variables (columns). Interpret your findings whether you have determined any relationship between variables. X1 X2 X3 X4 X5 The data (X1, X...
Compute the correlation coefficient, r, for all five variables (columns). Interpret your findings whether you have determined any relationship between variables. X1 X2 X3 X4 X5 The data (X1, X2, X3, X4, X5) are by city. 8 78 284 9.1 109 X1 = death rate per 1000 residents 9.3 68 433 8.7 144 X2 = doctor availability per 100,000 residents 7.5 70 739 7.2 113 X3 = hospital availability per 100,000 residents 8.9 96 1792 8.9 97 X4 = annual...
You have two groups of apples (data below). You want to see if there is a...
You have two groups of apples (data below). You want to see if there is a statistical differnce between the two groups. Run descriptives and a two tailed, two sample assuming equal variance t-test. Here's your data: Weight of Apples in Grams Apple ID Farm A Farm B 1 131 151 2 147 159 3 134 162 4 134 158 5 136 159 6 137 160 7 140 150 8 134 160 9 136 160 10 133 160 11 134...
Question #2 - Review 'Cars Database'. From this data set develop the following: a. One bivariate...
Question #2 - Review 'Cars Database'. From this data set develop the following: a. One bivariate regression b. One multiple regression c. Provide an effective chart displaying each of the two regressions. Charts should be presentation ready with effective title and labels. d. Provide a brief description of each of the two regressions (please use a text box in your Excel spreadsheet for your descriptions). Also, be sure to correctly identify and describe your independent and dependent variables, linear equation...
 11. A random sample of 72 guinea pigs was taken and injected with infcabious bacteria. Their survival times are: 43, 45, 53, 56, 56, 57, 58, 66, 67, 73, 74, 79, 80, 80, 81, 81, 81, 82, 83, 83, 84, 88, 89, 91, 91, 92, 92, 97, 99, 99, 100, 100, 101, 102, 102, 102, 103, 104, 107, 108, 109, 113, 114, 118, 121, 123, 126, 128, 137, 138, 139, 144, 145, 147, 156, 162, 174, 178, 179, 184, 191,...
 11. A random sample of 72 guinea pigs was taken and injected with infectious bacteria. Their survival times are: 43, 45, 53, 56, 56, 57, 58, 66, 67, 73, 74, 79, 80, 80, 81, 81, 81, 82, 83, 83, 84, 88, 89, 91, 91, 92, 92, 97, 99, 99, 100, 100, 101, 102, 102, 102, 103, 104, 107, 108, 109, 113, 114, 118, 121, 123, 126, 128, 137, 138, 139, 144, 145, 147, 156, 162, 174, 178, 179, 184, 191,...
 The following data represent glucose blood levels (mg/100 ml) after a 12-hour fast for a random sample of 70 women (Reference American Journal of Clinical Nutrition, Vol. 19, pp. 345-351) 45 668) 71 75 64 59 59 75 82 B0 81 85 77 82 90 87 72 70 69 83 71 87 69 81 76 96 83 67 94 101 94 89 94 73 99 93 85 83 90 78 80 85 83 84 74 81 70 65 89 70...
 Boys 111 107 100 The data to the left are IQ test scores for 47 seventh grade boys and 31 seventh grade girls from a Midwestern school district. 107 115 111 104 106 Do a test of hypothesis to see whether the mean test scores of the two groups are the same or different. Assume that the data represent a random sample from the population of 7th grade boys and girls from this school district. 113 109 113 128 128...
 Thomas Carey, single, claiming one exemption, has cumulative eamings before this biweekly pay period of $125,800. If he Social Security is 6.2% on $127,200 and Medicare is 1.45% on all earnings. (Round to the nearest cent as needed.) 囲(Click the icon to view the Single Persons-Biweekly Payroll Period federal income tax withholding table. The amount of Thomas Carey's deduction for FIT is $ The amount of Thomas Carey's deduction for FICA (OASDI) is $ The amount of Thomas Carey's deduction...
Most questions answered within 3 hours.
-
a. Discuss the reciprocal/opposite “hormonal” regulation of the
most highly regulated steps of these two pathways....
asked 9 minutes ago -
Suppose a floor on a hospital has 12 physicians at any given
time. You are brought...
asked 2 minutes ago -
Members of unions had mounted campaigns to persuade customers
not to shop at a company because...
asked 10 minutes ago -
Why is the alpha carboxyl group pka value 2 ?
And why is an alpha amino...
asked 19 minutes ago -
Identify and assess an intrapreneurial
opportunities within Bank of America and
intrapreneurial assessment. Assess its impact...
asked 25 minutes ago -
How do I figure out the range of possible numbers that can be
represented by the...
asked 27 minutes ago -
A 0.48-kg metal sphere oscillates at the end of a vertical
spring. As the spring stretches...
asked 30 minutes ago -
If a block of Si is doped with 10^17 Boron atom/cm^3 and 5X10^16
Arsenic atoms/cm^3,
(a)...
asked 56 minutes ago -
Why would natural selection not minimize costs (in the form of
symptoms) of evolved defenses? (choose...
asked 1 hour ago -
What is true about a critical task?
Latest finish time - latest start time = 0...
asked 1 hour ago -
A company uses a
process costing system. Its Assembly Department's beginning
inventory consisted of 56,800 units,...
asked 1 hour ago -
a
sealed glass cylinder contains 325 g of N2 gas at 1.02 atm at 20 c....
asked 1 hour ago