

Homework Answers
5(a)
| INTERVAL | FREQUENCY | PERCENT | MIDPOINT |
| 30-34 | 2 | 8% | 32 |
| 25-29 | 6 | 24% | 27 |
| 20-24 | 5 | 20% | 22 |
| 15-19 | 6 | 24% | 17 |
| 10-14 | 4 | 16% | 12 |
| 5-9 | 1 | 4% | 7 |
| 0-4 | 1 | 4% | 2 |
5(b)
histogram
using R programming language , coding is given below
>x<-c(22,18,22,26,19,14,13,27,2,18,28,28,11,16,34,28,13,21,32,17,6,29,23,22,19)
>hist(x,col="grey",main="histogram",xlab="x-axis",ylab="y-axis")

excel can also be used here.
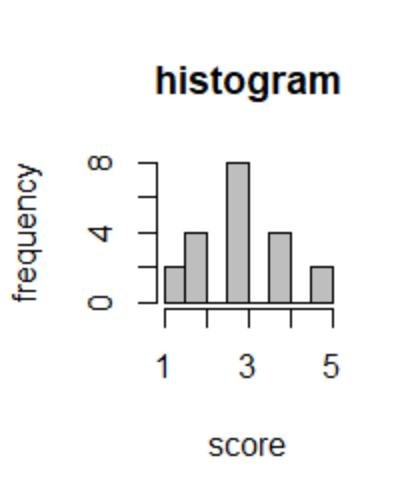
6(a)
| score | frequency | percent |
| 1 | 2 | 10% |
| 2 | 4 | 20% |
| 3 | 8 | 40% |
| 4 | 4 | 20% |
| 5 | 2 | 10% |
(b)
histogram using R programming language. coding is given below
> y<-c(3,2,3,4,1,3,3,4,5,2,3,5,2,3,3,4,1,3,2,4)
> hist(y,col="grey",main="histogram",
xlab="score",ylab="frequency")
Add Answer to:
Homework - Chapter 1. Student name: Question #5 These are the number of holiday gifts purchased...
MN 248 Fall 2019 Homework 4: Chapter 7 and 8 Name: Date: 2. Given the following...
 MN 248 Fall 2019 Homework 4: Chapter 7 and 8 Name: Date: 2. Given the following data in microinches for the surface roughness of a grinding operation, construct a multi-vari chart and analyze the results. Time 0700h 1400 h 2100 h Part No 120 21 82 22 83 145 146 147 38 26 31 32 19 I 28 14 Surface 28 8 30 29 9 5 11 15 Roughness 30 31 38 20 4 Measure 37 20 22 | 22...
Student Name Student Number 18. Describe the center and spread of the data using either the...
 Student Name Student Number 18. Describe the center and spread of the data using either the mean and standard deviation or the five-number summary. Justify your choice by constructing a box-and-whisker plot for the data. Be sure to include the scale. A. 47, 16, 70, 80, 28, 33, 91, 55, 60, 45, 86, 54, 30, 98, 34, 87, 44, 35,64,58, 27,67, 72,68, 31, 95, 37, 41, 97,56, 49, 71, 84, 66, 45, 93 B. 40, 39, 37, 26, 25, 40,...
For each variable of interest – Percent Time Asleep and Longevity – create a grouped frequency...
For each variable of interest – Percent Time Asleep and Longevity – create a grouped frequency histogram. For each histogram, use a class width of 10; use a lower limit of 0 for Percent Time Asleep and 15 for Longevity. Each histogram must include an informative title, along with correct labels for both axes. For each histogram, include a paragraph that answers each of the following questions: Is the histogram symmetric, skewed to the left, or skewed to the right?...
one question 2 pictures 2.4.8, pp 97 101. A student counts the number of chocolate chips...
 one question 2 pictures
2.4.8, pp 97 101. A student counts the number of chocolate chips in cookies and records the data shown in the table below (data collected by Emily Brandt, 2010). Determine relative frequency and also , and f(x), if the number of chocolate chips is described by a Poisson distribution. I 16 17 18 19 20 21 22 23 24 25 26 27 28 29 30 frequency 1 1 1 2 2 0 0 5 5 1...
one question 2 pictures
2.4.8, pp 97 101. A student counts the number of chocolate chips in cookies and records the data shown in the table below (data collected by Emily Brandt, 2010). Determine relative frequency and also , and f(x), if the number of chocolate chips is described by a Poisson distribution. I 16 17 18 19 20 21 22 23 24 25 26 27 28 29 30 frequency 1 1 1 2 2 0 0 5 5 1...
Chapter 1 Frequency Tables Score: 077 1/7 answered Question 7 > In a student survey, fifty-two...
 Chapter 1 Frequency Tables Score: 077 1/7 answered Question 7 > In a student survey, fifty-two part-time students were asked how many courses they were taking this term. The (incomplete) results are shown below: Please round your answer to 4 decimal places for the Relative Frequency if possible. # of Courses Frequency Relative Frequency Cumulative Frequency 1 0.2885 15 2 14 0.2692 29 3 23 What percent of students take exactly one courses? Hint: Frequency Tables Submit Question
Month Period Gas Usage 40544 1 202 40575 2 204 40603 3 198 40634 4 102...
Month Period Gas Usage 40544 1 202 40575 2 204 40603 3 198 40634 4 102 40664 5 58 40695 6 20 40725 7 18 40756 8 16 40787 9 18 40817 10 58 40848 11 154 40878 12 192 40909 13 206 40940 14 220 40969 15 202 41000 16 98 41030 17 48 41061 18 21 41091 19 17 41122 20 15 41153 21 38 41183 22 62 41214 23 198 41244 24 240 41275 25 247 41306...
Course Name: Financial Derivatives (F1N429) Quiz Number: 1 (Lecture W 5 Chapter 1 of Pundamentals of...
 Course Name: Financial Derivatives (F1N429) Quiz Number: 1 (Lecture W 5 Chapter 1 of Pundamentals of Putures and Options Markets Date: Jan 30, 2019 Session: 12:30-12:55 PM Time Allowed: 25Mi & OL ection: FI 429 ZAYED UNIVERSITY Student details 20 Name: Please solve all questions. Question # 1 (Max. Marks-4-2+2) Define a forward contract. How is it different from futures contract? Question # 2 (Max. Marks-6-2+2+2) Suppose that price of a share of City Bank on January 31, 2007 is...
13 12 11 10 8 6 7 P 5 P 4 3 r 1 2 MarvelUS...
 13 12 11 10 8 6 7 P 5 P 4 3 r 1 2 MarvelUS is a service that streams shows and movies over the internet. As a new subscriber, Gary counted the number of episodes that are available through the service for a selection of his favorite shows. The histogram below summarizes the data. Use the histogram to answer each of the questions. (a) How many shows have from 11 to 16 episodes available? Frequency (Number of shows)...
Fest ALEKS Ca'p. Week 3 Homework < 17 18 19 20 21 22 23 24 Question...
 Fest ALEKS Ca'p. Week 3 Homework < 17 18 19 20 21 22 23 24 Question 34 of 37 (1 point) Attempt 1 of 3 Evaluate the combination. 10 = Х 5
The incubation rates for the mysterious "O" Virus has been recorded in days. The number of...
The incubation rates for the mysterious "O" Virus has been recorded in days. The number of days ranges from 5 - 37. 05 06 22 23 34 17 17 26 37 25 17 10 30 06 22 33 06 22 10 27 10 37 13 26 19 27 21 31 22 15 14 28 17 13 28 22 34 17 13 10 In the space below, arrange your data into an array. Select your intervals. Explain your rationale for the...
 MN 248 Fall 2019 Homework 4: Chapter 7 and 8 Name: Date: 2. Given the following data in microinches for the surface roughness of a grinding operation, construct a multi-vari chart and analyze the results. Time 0700h 1400 h 2100 h Part No 120 21 82 22 83 145 146 147 38 26 31 32 19 I 28 14 Surface 28 8 30 29 9 5 11 15 Roughness 30 31 38 20 4 Measure 37 20 22 | 22...
 Student Name Student Number 18. Describe the center and spread of the data using either the mean and standard deviation or the five-number summary. Justify your choice by constructing a box-and-whisker plot for the data. Be sure to include the scale. A. 47, 16, 70, 80, 28, 33, 91, 55, 60, 45, 86, 54, 30, 98, 34, 87, 44, 35,64,58, 27,67, 72,68, 31, 95, 37, 41, 97,56, 49, 71, 84, 66, 45, 93 B. 40, 39, 37, 26, 25, 40,...
 one question 2 pictures
2.4.8, pp 97 101. A student counts the number of chocolate chips in cookies and records the data shown in the table below (data collected by Emily Brandt, 2010). Determine relative frequency and also , and f(x), if the number of chocolate chips is described by a Poisson distribution. I 16 17 18 19 20 21 22 23 24 25 26 27 28 29 30 frequency 1 1 1 2 2 0 0 5 5 1...
one question 2 pictures
2.4.8, pp 97 101. A student counts the number of chocolate chips in cookies and records the data shown in the table below (data collected by Emily Brandt, 2010). Determine relative frequency and also , and f(x), if the number of chocolate chips is described by a Poisson distribution. I 16 17 18 19 20 21 22 23 24 25 26 27 28 29 30 frequency 1 1 1 2 2 0 0 5 5 1...
 Chapter 1 Frequency Tables Score: 077 1/7 answered Question 7 > In a student survey, fifty-two part-time students were asked how many courses they were taking this term. The (incomplete) results are shown below: Please round your answer to 4 decimal places for the Relative Frequency if possible. # of Courses Frequency Relative Frequency Cumulative Frequency 1 0.2885 15 2 14 0.2692 29 3 23 What percent of students take exactly one courses? Hint: Frequency Tables Submit Question
 Course Name: Financial Derivatives (F1N429) Quiz Number: 1 (Lecture W 5 Chapter 1 of Pundamentals of Putures and Options Markets Date: Jan 30, 2019 Session: 12:30-12:55 PM Time Allowed: 25Mi & OL ection: FI 429 ZAYED UNIVERSITY Student details 20 Name: Please solve all questions. Question # 1 (Max. Marks-4-2+2) Define a forward contract. How is it different from futures contract? Question # 2 (Max. Marks-6-2+2+2) Suppose that price of a share of City Bank on January 31, 2007 is...
 13 12 11 10 8 6 7 P 5 P 4 3 r 1 2 MarvelUS is a service that streams shows and movies over the internet. As a new subscriber, Gary counted the number of episodes that are available through the service for a selection of his favorite shows. The histogram below summarizes the data. Use the histogram to answer each of the questions. (a) How many shows have from 11 to 16 episodes available? Frequency (Number of shows)...
 Fest ALEKS Ca'p. Week 3 Homework < 17 18 19 20 21 22 23 24 Question 34 of 37 (1 point) Attempt 1 of 3 Evaluate the combination. 10 = Х 5
Most questions answered within 3 hours.
-
What is facilitated diffusion and how does it differ from
symport and antiport transportation? How do...
asked 1 minute ago -
if a firm producing 100 units at $5.00 each experience
an 80% experience curve, what will...
asked 38 minutes ago -
A solid, uniform disk of radius 0.250 m and mass 53.7 kg rolls
down a ramp...
asked 2 hours ago -
Given the following table of high speed internet access vs.
annual home income:
Home Income
%...
asked 3 hours ago -
A baseball batter hits a 0.145kg baseball straight up into the
air. The baseball leaves the...
asked 3 hours ago -
An FM modulator is tested using
single-tone baseband signal with frequency of 50kHz and a sprectrum...
asked 4 hours ago -
Write the ionic equations for the first stage of salts
hydrolysis.
Anion, Cation?
Na2S
NiSO4
K2SO4...
asked 5 hours ago -
suppose there is a normally distributed population with a mean of
250 and a standard deviation...
asked 6 hours ago -
Question Three
Suppose you as project manager are using the Waterfall
development methodology on a large...
asked 7 hours ago -
Which statement is not true about welfare in Canada?
A.Benefits typically vary based on one's ability...
asked 8 hours ago -
Please help me with FLOWCHART and UML diagram for class,
thank you!
#include <iostream>
#include <fstream>...
asked 8 hours ago -
3. Describe the “logic circuit” of the Lac operon. Which
proteins are bound or not to...
asked 8 hours ago