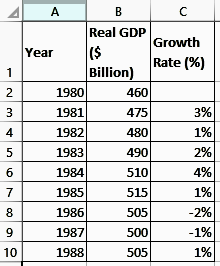
The following table shows data on a hypothetical country's real GDP from 1980 through 1988:
The following table shows data on a hypothetical country's real GDP from 1980 through 1988:
| Year | Real GDP |
|---|---|
| (Billions of Dollars) | |
| 1980 | 460 |
| 1981 | 475 |
| 1982 | 480 |
| 1983 | 490 |
| 1984 | 510 |
| 1985 | 515 |
| 1986 | 505 |
| 1987 | 500 |
| 1988 | 505 |
The green line on the following graph shows the economy's long-term growth trend.
Use the blue points (circle symbol) to plot the real GDP in each of the years listed. (Note: Plot your points in the order in which you would like them connected. Line segments will connect the points automatically.) Next, place the black point (plus symbol) on the graph to indicate the point on the real GDP curve that definitely represents a peak. Finally, place the grey point (star symbol) on the graph to indicate the point on the real GDP curve that definitely represents a trough.

Calculate the percentage change in real GDP in each of the years shown. (Hint: The percentage change in real GDP equals the change in GDP from the previous year to the current year. For example, you can calculate the percentage change for 1981 by finding the change in GDP from 1980 to 1981, dividing this change by the level of GDP in 1980, and then multiplying the result by 100.)
Once you've calculated the percentage change for each of the years, use the orange points (square symbol) to plot your results on the following graph, rounded to the nearest percent. For each year, plot the percentage change from the year before. (Hint: For example, you should plot the growth rate from 1980 to 1981 with a horizontal coordinate of 1981.)

This economy experienced a contraction in the years . On the first graph (showing real GDP), this contraction is seen as a period in which the level of real GDP
. On the second graph (showing annual change in real GDP), this contraction is seen as a period in which the growth rate of real GDP
.
True or False: This economy was experiencing an expansion in 1981.
Homework Answers
Answer :
From graph shown below, the contraction is seen as a period when the level of Real GDP decreased.

On graph shown below, the contraction is seen as a period when the growth rate of real GDP decreased.

In 1983, the business was experiencing a Expansion.
False.
2. Economic fluctuations and growth
The following table shows data on a hypothetical country's real GDP from 1980 through 1988:
| Year | Real GDP |
|---|---|
| (Billions of Dollars) | |
| 1980 | 372 |
| 1981 | 380 |
| 1982 | 384 |
| 1983 | 404 |
| 1984 | 400 |
| 1985 | 388 |
| 1986 | 392 |
| 1987 | 400 |
| 1988 | 404 |
The green line on the following graph shows the economy's long-term growth trend.
Use the blue points (circle symbol) to plot the real GDP in each of the years listed. (Note: Plot your points in the order in which you would like them connected. Line segments will connect the points automatically.) Next, place the black point (plus symbol) on the graph to indicate the point on the real GDP curve that definitely represents a peak. Finally, place the grey point (star symbol) on the graph to indicate the point on the real GDP curve that definitely represents a trough.
Calculate the percentage change in real GDP in each of the years shown. (Hint: The percentage change in real GDP equals the change in GDP from the previous year to the current year. For example, you can calculate the percentage change for 1981 by finding the change in GDP from 1980 to 1981, dividing this change by the level of GDP in 1980, and then multiplying the result by 100.)
Once you've calculated the percentage change for each of the years, use the orange points (square symbol) to plot your results on the following graph, rounded to the nearest percent. For each year, plot the percentage change from the year before. (Hint: For example, you should plot the growth rate from 1980 to 1981 with a horizontal coordinate of 1981.)
This economy experienced a contraction in the years . On the first graph (showing real GDP), this contraction is seen as a period in which the level of real GDP
. On the second graph (showing annual change in real GDP), this contraction is seen as a period in which the growth rate of real GDP
.
True or False: This economy was experiencing an expansion in 1981.
Add Answer to:
The following table shows data on a hypothetical country's real GDP from 1980 through 1988:
Please clearly label the graphs and show all the work. Thank you :) 2. Economic fluctuations...
 Please clearly label
the graphs and show all the work. Thank you :)
2. Economic fluctuations and growth The following table shows data on a hypothetical country's real GDP from 1980 through 1988: Year 1980 1981 1982 1983 1984 1985 1986 1987 1988 Real GDP (Billions of Dollars) 465 475 480 505 500 485 490 500 505 The green line on the following graph shows the economy's long-term growth trend Use the blue points (circle symbol) to plot the real...
Please clearly label
the graphs and show all the work. Thank you :)
2. Economic fluctuations and growth The following table shows data on a hypothetical country's real GDP from 1980 through 1988: Year 1980 1981 1982 1983 1984 1985 1986 1987 1988 Real GDP (Billions of Dollars) 465 475 480 505 500 485 490 500 505 The green line on the following graph shows the economy's long-term growth trend Use the blue points (circle symbol) to plot the real...
The following table shows data on a hypothetical country's Real GDP from 1970 through 1978: Real...
 The following table shows data on a hypothetical country's Real GDP from 1970 through 1978: Real GDP Year (Billions of Dollars) 1970 192 1971 1972 1973 1974 1975 1976 1977 206 202 200 202 1978 210 ols The green line on the following graph shows the economy's long-term growth trend. ciples of Use the blue points (circle symbol) to plot the Real GDP in each of the years listed. (Note: Plot your points in the order in which you would...
Pls help me graph rate of change in real gdp and answer thosequestionsReal GDP...
 Pls help me graph rate of change in real gdp and answer those
questionsCalculate the percentage change in real GDP in each of the years shown. (Hint: The percentage change in real GDP equals the change in GDP from the previous year to the current year. For example, you can calculate the percentage change for 1981 by finding the change in GDP from 1980 to 1981, dividing this change by the level of GDP in 1980, and then multiplying the...
Pls help me graph rate of change in real gdp and answer those
questionsCalculate the percentage change in real GDP in each of the years shown. (Hint: The percentage change in real GDP equals the change in GDP from the previous year to the current year. For example, you can calculate the percentage change for 1981 by finding the change in GDP from 1980 to 1981, dividing this change by the level of GDP in 1980, and then multiplying the...
1. Economic fluctuations and growth Real GDP (Billions of dollars) 376 380 388 408 404 Year 2000 2001 2004 2005 2006 2007 2008 400 412 The grey line on the following graph shows the economy...
 1. Economic fluctuations and growth Real GDP (Billions of dollars) 376 380 388 408 404 Year 2000 2001 2004 2005 2006 2007 2008 400 412 The grey line on the following graph shows the economy's long-term growth trend Use the blue points (circle symbol) to plot the real GDP in each of the years listed. Be sure to plot from ieft to right. Line segments will automatically connect the points. Next, place the green triangle on the graph to indicate...
In the graph below of the Number of Voluntary Bankruptcies Filed during 1981-1994, which statement best...
 In the graph below of the Number of Voluntary Bankruptcies Filed during 1981-1994, which statement best describes the information presented in the line graph? 1000 900 800 700 600 500 400 300 200 100 0 1981 1982 1983 1984 1985 1986 1987 1988 1989 1990 1991 1992 1993 1994 Year The amount of money bankrupt people owed from 1981 to 1992 increased then decreased The 1980's proved to be a time in which people did not file for bankruptcy but...
The graph gross national product (GNP) for the years 1983-1988. f the accompanying figure shows the...
 The graph gross national product (GNP) for the years 1983-1988. f the accompanying figure shows the average annual percentage change y= f(t) in a particular country's Choose the correct graph of O B. A. Ay (% ) 10- 10- 10- 6 TaRe 1 -101 2 O D. C. A 1984 1987 1983 1985 1988 10- 1983 19830 -10- 10
The graph gross national product (GNP) for the years 1983-1988. f the accompanying figure shows the average annual percentage change y=...
The graph gross national product (GNP) for the years 1983-1988. f the accompanying figure shows the average annual percentage change y= f(t) in a particular country's Choose the correct graph of O B. A. Ay (% ) 10- 10- 10- 6 TaRe 1 -101 2 O D. C. A 1984 1987 1983 1985 1988 10- 1983 19830 -10- 10
The graph gross national product (GNP) for the years 1983-1988. f the accompanying figure shows the average annual percentage change y=...
The following table gives the percentage, P, of households with a television set that also have a...
 The following table gives the percentage, P, of households with a television set that also have a VCR. (Unlike the data in your textbook, this data is ficticious) 1978 1979 1980 1981 1982 1983 1984 1985 1986 1987 1988 1989 1990 1991 |605 Year % having VCR 0.2 0.4 0.8 1.4 2.9 5.4 9.5 16.7 25.4 37.9 46.5 53.8 56.7 (a) During what year does the point of "diminishing returns" (G.e., the inflection point) appear to take place? During the...
The record of average yearly flow for 15 years of a river is given in table-1....
 The record of average yearly flow for 15 years of a river is
given in table-1. If the available head is 14 m, construct the flow
duration curve and power duration curve for the river.
1 Table-1 S. No. 3 4 5 Year 1980 1981 1982 1983 1984 Flow (Cumecs) 500 665 550 479 875 6 1985 655 7 1986 1000 8 1987 1250 9 1988 900 10 1989 700 11 1990 850 12 1991 1050 13 1992 985 14...
The record of average yearly flow for 15 years of a river is
given in table-1. If the available head is 14 m, construct the flow
duration curve and power duration curve for the river.
1 Table-1 S. No. 3 4 5 Year 1980 1981 1982 1983 1984 Flow (Cumecs) 500 665 550 479 875 6 1985 655 7 1986 1000 8 1987 1250 9 1988 900 10 1989 700 11 1990 850 12 1991 1050 13 1992 985 14...
7. Study the table below and identify the following: a. years in which the economy expanded...
 7. Study the table below and identify the following: a. years in which the economy expanded b. years in which the economy contracted c. peaks d. troughs Year 1998 Annual Percentage Change in Real GDP (2007 $) -3.1 2.6 5.7 5.2 2.8 4.6 Year 1982 1983 1984 1985 1986 1987 1988 1989 1990 1991 1992 1993 1994 1995 1996 1997 Annual Percentage Change in Real GDP (2007 $) 4.1 5.4 5.4 1.4 2.7 2.0 3.1 3.2 2.4 2.2 1.1 -2.9...
QUESTION 3 Use the data given below to answer the following question(s). The worldwide sales of...
QUESTION 3 Use the data given below to answer the following question(s). The worldwide sales of cars from 1981-1990 are shown in the table below. Given: α = 0.2 and β = 0.15 (Hint: Use XLMiner) Units sold in Year thousands 1981 888 1982 900 1983 1000 1984 1200 1985 1100 1986 1300 1987 1250 1988 1150 1989 1100 1990 1200 For the given data, what is the sales forecast for the year 1992 (in thousands)? 1256.87 1317.91 1285.74 1350.08
 Please clearly label
the graphs and show all the work. Thank you :)
2. Economic fluctuations and growth The following table shows data on a hypothetical country's real GDP from 1980 through 1988: Year 1980 1981 1982 1983 1984 1985 1986 1987 1988 Real GDP (Billions of Dollars) 465 475 480 505 500 485 490 500 505 The green line on the following graph shows the economy's long-term growth trend Use the blue points (circle symbol) to plot the real...
Please clearly label
the graphs and show all the work. Thank you :)
2. Economic fluctuations and growth The following table shows data on a hypothetical country's real GDP from 1980 through 1988: Year 1980 1981 1982 1983 1984 1985 1986 1987 1988 Real GDP (Billions of Dollars) 465 475 480 505 500 485 490 500 505 The green line on the following graph shows the economy's long-term growth trend Use the blue points (circle symbol) to plot the real...
 The following table shows data on a hypothetical country's Real GDP from 1970 through 1978: Real GDP Year (Billions of Dollars) 1970 192 1971 1972 1973 1974 1975 1976 1977 206 202 200 202 1978 210 ols The green line on the following graph shows the economy's long-term growth trend. ciples of Use the blue points (circle symbol) to plot the Real GDP in each of the years listed. (Note: Plot your points in the order in which you would...
 Pls help me graph rate of change in real gdp and answer those
questionsCalculate the percentage change in real GDP in each of the years shown. (Hint: The percentage change in real GDP equals the change in GDP from the previous year to the current year. For example, you can calculate the percentage change for 1981 by finding the change in GDP from 1980 to 1981, dividing this change by the level of GDP in 1980, and then multiplying the...
Pls help me graph rate of change in real gdp and answer those
questionsCalculate the percentage change in real GDP in each of the years shown. (Hint: The percentage change in real GDP equals the change in GDP from the previous year to the current year. For example, you can calculate the percentage change for 1981 by finding the change in GDP from 1980 to 1981, dividing this change by the level of GDP in 1980, and then multiplying the...
 1. Economic fluctuations and growth Real GDP (Billions of dollars) 376 380 388 408 404 Year 2000 2001 2004 2005 2006 2007 2008 400 412 The grey line on the following graph shows the economy's long-term growth trend Use the blue points (circle symbol) to plot the real GDP in each of the years listed. Be sure to plot from ieft to right. Line segments will automatically connect the points. Next, place the green triangle on the graph to indicate...
 In the graph below of the Number of Voluntary Bankruptcies Filed during 1981-1994, which statement best describes the information presented in the line graph? 1000 900 800 700 600 500 400 300 200 100 0 1981 1982 1983 1984 1985 1986 1987 1988 1989 1990 1991 1992 1993 1994 Year The amount of money bankrupt people owed from 1981 to 1992 increased then decreased The 1980's proved to be a time in which people did not file for bankruptcy but...
 The graph gross national product (GNP) for the years 1983-1988. f the accompanying figure shows the average annual percentage change y= f(t) in a particular country's Choose the correct graph of O B. A. Ay (% ) 10- 10- 10- 6 TaRe 1 -101 2 O D. C. A 1984 1987 1983 1985 1988 10- 1983 19830 -10- 10
The graph gross national product (GNP) for the years 1983-1988. f the accompanying figure shows the average annual percentage change y=...
The graph gross national product (GNP) for the years 1983-1988. f the accompanying figure shows the average annual percentage change y= f(t) in a particular country's Choose the correct graph of O B. A. Ay (% ) 10- 10- 10- 6 TaRe 1 -101 2 O D. C. A 1984 1987 1983 1985 1988 10- 1983 19830 -10- 10
The graph gross national product (GNP) for the years 1983-1988. f the accompanying figure shows the average annual percentage change y=...
 The following table gives the percentage, P, of households with a television set that also have a VCR. (Unlike the data in your textbook, this data is ficticious) 1978 1979 1980 1981 1982 1983 1984 1985 1986 1987 1988 1989 1990 1991 |605 Year % having VCR 0.2 0.4 0.8 1.4 2.9 5.4 9.5 16.7 25.4 37.9 46.5 53.8 56.7 (a) During what year does the point of "diminishing returns" (G.e., the inflection point) appear to take place? During the...
 The record of average yearly flow for 15 years of a river is
given in table-1. If the available head is 14 m, construct the flow
duration curve and power duration curve for the river.
1 Table-1 S. No. 3 4 5 Year 1980 1981 1982 1983 1984 Flow (Cumecs) 500 665 550 479 875 6 1985 655 7 1986 1000 8 1987 1250 9 1988 900 10 1989 700 11 1990 850 12 1991 1050 13 1992 985 14...
The record of average yearly flow for 15 years of a river is
given in table-1. If the available head is 14 m, construct the flow
duration curve and power duration curve for the river.
1 Table-1 S. No. 3 4 5 Year 1980 1981 1982 1983 1984 Flow (Cumecs) 500 665 550 479 875 6 1985 655 7 1986 1000 8 1987 1250 9 1988 900 10 1989 700 11 1990 850 12 1991 1050 13 1992 985 14...
 7. Study the table below and identify the following: a. years in which the economy expanded b. years in which the economy contracted c. peaks d. troughs Year 1998 Annual Percentage Change in Real GDP (2007 $) -3.1 2.6 5.7 5.2 2.8 4.6 Year 1982 1983 1984 1985 1986 1987 1988 1989 1990 1991 1992 1993 1994 1995 1996 1997 Annual Percentage Change in Real GDP (2007 $) 4.1 5.4 5.4 1.4 2.7 2.0 3.1 3.2 2.4 2.2 1.1 -2.9...
Most questions answered within 3 hours.
-
D. A student completed 20 courses in the School of Arts and
Sciences. Her grades in...
asked 1 hour ago -
teo
pucks moving on a frictionless air table are about to collide. the
1.5 kg puck...
asked 1 hour ago -
Problem #1
The area between Z = 0 and Z = 2.50
The area between Z...
asked 3 hours ago -
1. What is the meaning of the term communication style?
2. What are the benefits to...
asked 2 hours ago -
9.) You are buying a car that cost $26,500. You make payments of
$412 each month...
asked 2 hours ago -
. Suppose a discrete random variable has probability
distribution
P(x) = .2 if x = 0...
asked 4 hours ago -
Under the influence of its drive force, a snowmobile is moving
at a constant velocity along...
asked 4 hours ago -
Why do organizations decline? What steps can top
management take to halt, decline, and restore organizational...
asked 4 hours ago -
What mechanisms Drive speciation??
(I.e. what was Dawins theory on the orgin of species, and how...
asked 5 hours ago -
The manager at a car assembly plant believes that the mean
assembly time for a car...
asked 6 hours ago -
Which of the following is true of electron capture?
A) It decreases the nuclide's mass number...
asked 8 hours ago -
Assuming an efficiency of 43.10%, calculate the actual yield of
magnesium nitrate formed from 114.9 g...
asked 8 hours ago