QUESTION 3 Use the data given below to answer the following question(s). The worldwide sales of...
QUESTION 3
-
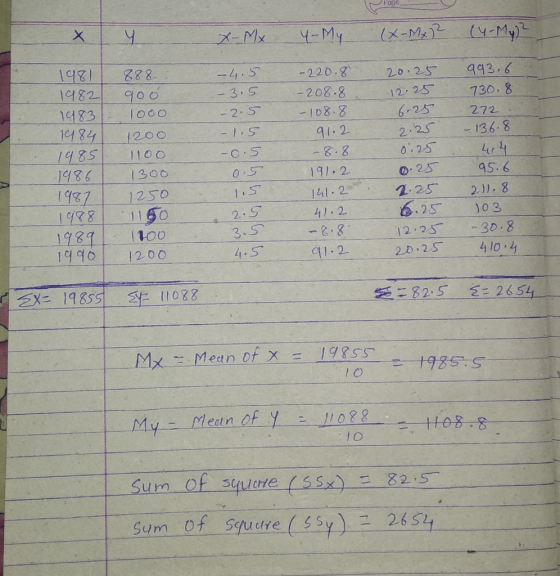
Use the data given below to answer the following question(s).
The worldwide sales of cars from 1981-1990 are shown in the table below. Given: α = 0.2 and β
= 0.15 (Hint: Use XLMiner)
Units sold in
Year thousands
1981 888
1982 900
1983 1000
1984 1200
1985 1100
1986 1300
1987 1250
1988 1150
1989 1100
1990 1200
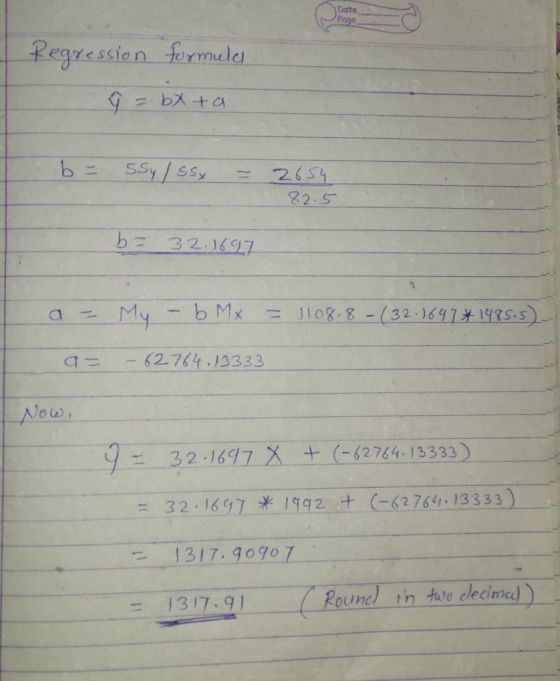
For the given data, what is the sales forecast for the year 1992 (in thousands)?
1256.87
1317.91
1285.74
1350.08
Homework Answers
Ans
B) 1317.91
Add Answer to:
QUESTION 3 Use the data given below to answer the following question(s). The worldwide sales of...
In the graph below of the Number of Voluntary Bankruptcies Filed during 1981-1994, which statement best...
 In the graph below of the Number of Voluntary Bankruptcies Filed during 1981-1994, which statement best describes the information presented in the line graph? 1000 900 800 700 600 500 400 300 200 100 0 1981 1982 1983 1984 1985 1986 1987 1988 1989 1990 1991 1992 1993 1994 Year The amount of money bankrupt people owed from 1981 to 1992 increased then decreased The 1980's proved to be a time in which people did not file for bankruptcy but...
The record of average yearly flow for 15 years of a river is given in table-1....
 The record of average yearly flow for 15 years of a river is
given in table-1. If the available head is 14 m, construct the flow
duration curve and power duration curve for the river.
1 Table-1 S. No. 3 4 5 Year 1980 1981 1982 1983 1984 Flow (Cumecs) 500 665 550 479 875 6 1985 655 7 1986 1000 8 1987 1250 9 1988 900 10 1989 700 11 1990 850 12 1991 1050 13 1992 985 14...
The record of average yearly flow for 15 years of a river is
given in table-1. If the available head is 14 m, construct the flow
duration curve and power duration curve for the river.
1 Table-1 S. No. 3 4 5 Year 1980 1981 1982 1983 1984 Flow (Cumecs) 500 665 550 479 875 6 1985 655 7 1986 1000 8 1987 1250 9 1988 900 10 1989 700 11 1990 850 12 1991 1050 13 1992 985 14...
Use the data given below to answer the following question(s). The worldwide sales of cars from 19...
Use the data given below to answer the following question(s). The worldwide sales of cars from 1981-1990 are shown in the table below. Given: α = 0.2, γ = 0.5, and season length = 1. (Hint: UseXLMiner). Units sold in Year thousands 1 750 2 823 3 1034 4 1945 5 1556 6 1300 7 1346 8 1150 9 967 10 1200 Calculate the value of the mean absolute percentage error using the Holt-Winters no-trend model for the given data....
Listed below are the numbers of people who have been executed in the US in each...
Listed below are the numbers of people who have been executed in the US in each year from 1976 (the year the US Supreme court’s decision allowing the death penalty to be carried out) to 1994. Use the data to create a chart of execution per year. How has the number of execution varied since 1976? (using excel) Year Number of executions Year Number of executions 1976 0 1986 18 1977 1 1987 25 1978 0 1988 11 1979 2...
The following table gives the percentage, P, of households with a television set that also have a...
 The following table gives the percentage, P, of households with a television set that also have a VCR. (Unlike the data in your textbook, this data is ficticious) 1978 1979 1980 1981 1982 1983 1984 1985 1986 1987 1988 1989 1990 1991 |605 Year % having VCR 0.2 0.4 0.8 1.4 2.9 5.4 9.5 16.7 25.4 37.9 46.5 53.8 56.7 (a) During what year does the point of "diminishing returns" (G.e., the inflection point) appear to take place? During the...
A. Use a 3-year moving average to forecast the quantity of fish for the years 1983 through 2006 for these data...
 A. Use a 3-year moving average to forecast the quantity of fish for the years 1983 through 2006 for these data. Compute the error of each forecast and then determine the mean absolute deviation of error for the forecast. B. Use exponential smoothing and a = 0.2 to forecast the data through 2006. Let the forecast for 1981 equal the actual value for 1980. Compute the error of each forecast and then determine the mean absolute deviation of error for...
The data set on the right contains the real per capita GDP for 2 countries from the Penn World Table (PWT) version 9.1 (Feenstra et al., 2015). The column names are the country codes, OMN and PSE. You may copy the dataset to Excel or R to do the computati
 YearOMN197011266197176221972632319735051197473381975802219768360197793611978965919791092719801149919811280319821276619831242319841306419851403219861019219871005419888809198992381990105911991991819921026319931004519949747199510199199611054199711784199811560199913501200016173200116853200218508200320329200425768200526647200638458200740960200847136200938538201040305201144477201247334201344979201440855201532460201629939201728249
The following table shows data on a hypothetical country's real GDP from 1980 through 1988:
 The following table shows data on a hypothetical country's real GDP from 1980 through 1988:YearReal GDP(Billions of Dollars)198046019814751982480198349019845101985515198650519875001988505The green line on the following graph shows the economy's long-term growth trend.Use the blue points (circle symbol) to plot the real GDP in each of the years listed. (Note: Plot your points in the order in which you would like them connected. Line segments will connect the points automatically.) Next, place the black point (plus symbol) on the graph to indicate the...
FIREARM DEATHS Download the Excel file Firearm.xls for use in this question. The number of deaths...
 FIREARM DEATHS Download the Excel file Firearm.xls for use in
this question. The number of deaths due to firearms in the United
States between 1968 and 1993 are given in the Excel file.
Answer the following using the research hypothesis, "there is a
correlation between year and number of firearm deaths in the
US."
A. What is the value of the correlation coefficient between
year and number of firearm deaths? (Answer to 3 decimal
places)
B. How many degrees of freedom...
FIREARM DEATHS Download the Excel file Firearm.xls for use in
this question. The number of deaths due to firearms in the United
States between 1968 and 1993 are given in the Excel file.
Answer the following using the research hypothesis, "there is a
correlation between year and number of firearm deaths in the
US."
A. What is the value of the correlation coefficient between
year and number of firearm deaths? (Answer to 3 decimal
places)
B. How many degrees of freedom...
2.5. Here are data on the number of people bitten by alligators in Florida over a...
 2.5. Here are data on the number of people bitten by alligators in Florida over a 36-year period. Make two graphs of these data to illustrate why you should always make a time plot for data collected over time a) Make a histogram of the counts of people bitten by alligators. The distribution has an irregular shape What is the midpoint of the yearly counts of people bitten? b) Make a time plot. There is a great variation from year...
 In the graph below of the Number of Voluntary Bankruptcies Filed during 1981-1994, which statement best describes the information presented in the line graph? 1000 900 800 700 600 500 400 300 200 100 0 1981 1982 1983 1984 1985 1986 1987 1988 1989 1990 1991 1992 1993 1994 Year The amount of money bankrupt people owed from 1981 to 1992 increased then decreased The 1980's proved to be a time in which people did not file for bankruptcy but...
 The record of average yearly flow for 15 years of a river is
given in table-1. If the available head is 14 m, construct the flow
duration curve and power duration curve for the river.
1 Table-1 S. No. 3 4 5 Year 1980 1981 1982 1983 1984 Flow (Cumecs) 500 665 550 479 875 6 1985 655 7 1986 1000 8 1987 1250 9 1988 900 10 1989 700 11 1990 850 12 1991 1050 13 1992 985 14...
The record of average yearly flow for 15 years of a river is
given in table-1. If the available head is 14 m, construct the flow
duration curve and power duration curve for the river.
1 Table-1 S. No. 3 4 5 Year 1980 1981 1982 1983 1984 Flow (Cumecs) 500 665 550 479 875 6 1985 655 7 1986 1000 8 1987 1250 9 1988 900 10 1989 700 11 1990 850 12 1991 1050 13 1992 985 14...
 The following table gives the percentage, P, of households with a television set that also have a VCR. (Unlike the data in your textbook, this data is ficticious) 1978 1979 1980 1981 1982 1983 1984 1985 1986 1987 1988 1989 1990 1991 |605 Year % having VCR 0.2 0.4 0.8 1.4 2.9 5.4 9.5 16.7 25.4 37.9 46.5 53.8 56.7 (a) During what year does the point of "diminishing returns" (G.e., the inflection point) appear to take place? During the...
 A. Use a 3-year moving average to forecast the quantity of fish for the years 1983 through 2006 for these data. Compute the error of each forecast and then determine the mean absolute deviation of error for the forecast. B. Use exponential smoothing and a = 0.2 to forecast the data through 2006. Let the forecast for 1981 equal the actual value for 1980. Compute the error of each forecast and then determine the mean absolute deviation of error for...
 FIREARM DEATHS Download the Excel file Firearm.xls for use in
this question. The number of deaths due to firearms in the United
States between 1968 and 1993 are given in the Excel file.
Answer the following using the research hypothesis, "there is a
correlation between year and number of firearm deaths in the
US."
A. What is the value of the correlation coefficient between
year and number of firearm deaths? (Answer to 3 decimal
places)
B. How many degrees of freedom...
FIREARM DEATHS Download the Excel file Firearm.xls for use in
this question. The number of deaths due to firearms in the United
States between 1968 and 1993 are given in the Excel file.
Answer the following using the research hypothesis, "there is a
correlation between year and number of firearm deaths in the
US."
A. What is the value of the correlation coefficient between
year and number of firearm deaths? (Answer to 3 decimal
places)
B. How many degrees of freedom...
 2.5. Here are data on the number of people bitten by alligators in Florida over a 36-year period. Make two graphs of these data to illustrate why you should always make a time plot for data collected over time a) Make a histogram of the counts of people bitten by alligators. The distribution has an irregular shape What is the midpoint of the yearly counts of people bitten? b) Make a time plot. There is a great variation from year...
Most questions answered within 3 hours.
-
A nozzle with a radius of 0.250 cm is attached to a garden hose
with a...
asked 2 minutes ago -
Please help me with me. I did the first part to write the operations but in...
asked 8 minutes ago -
PLEASE do not use any loops for the program; only recursion is
allowed
4. Write a...
asked 11 minutes ago -
Use Cryptool to find the Cryptographic SHA-1 hash value of the
string "abc". The calculator is...
asked 13 minutes ago -
You are attempting to calculate a firm’s free cash flow to
equity. You know the following...
asked 1 hour ago -
the following reaction occurs in a balloon containing
N2O2 gas
N2O4(g)=2NO2(g)
will the volume of the...
asked 1 hour ago -
answer the questions throughout this program
public class Day implements Comparable {
Private Boolean atWork;...
asked 1 hour ago -
This is C++ code for parking fee management program
#include <iostream>
#include <iomanip>
using namespace std;...
asked 1 hour ago -
The free energy change for the following reaction at 25 °C, when
[Sn2+] = 1.17 M...
asked 3 hours ago -
An MNE is this kind of industry when competition in one country
is essentially independent of...
asked 5 hours ago -
. For this set of questions, determine what
proportion of a normal distribution is located betweeneach...
asked 5 hours ago -
A college student is employed as a door-to-door newspaper
salesman. Historical data suggests that the student...
asked 6 hours ago