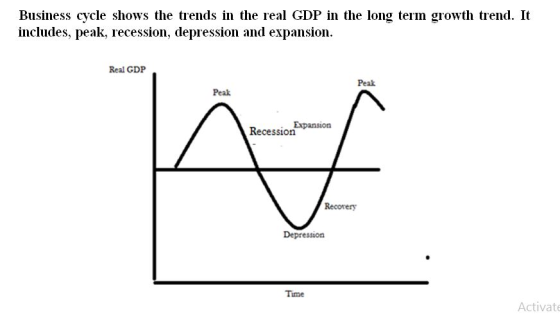
Know how to label 4 of the graphs (circular flow diagram, Phillips curve, business cycle ,...
- Know how to label 4 of the graphs (circular flow diagram, Phillips curve, business cycle , loanable funds model)
Homework Answers


Add Answer to:
Know how to label 4 of the graphs (circular flow diagram,
Phillips curve, business cycle ,...
Problem 2 “The Business Cycle” (20 points) (4 pts) What is the Phillips curve used for?...
Problem 2 “The Business Cycle” (20 points) (4 pts) What is the Phillips curve used for? (8 pts) How do you use a Phillips curve to illustrate an unexpected change in inflation? (8 pts) If the expected inflation rate increases by 10 percentage points, how do the short-run Phillips curve and the long-run Phillips curve converge?
Use the diagram of the Keynesian cross or loanable funds model to show how an increase in taxes shifts the IS curve. Be...
Use the diagram of the Keynesian cross or loanable funds model to show how an increase in taxes shifts the IS curve. Be sure to label: i. the axes; ii. the curves; iii. the initial equilibrium values; iv. the direction the curve shifts; and v. the terminal equilibrium values.
Label each component of the circular flow diagram.
 Label each component of the circular flow diagram.
Use the diagram of the Keynesian cross or loanable funds model to show how an increase...
Use the diagram of the Keynesian cross or loanable funds model to show how an increase in taxes shifts the IS curve. Be sure to label: i. the axes; ii. the curves; iii. the initial equilibrium values; iv. the direction the curve shifts; and v. the terminal equilibrium values
6. Use the diagram of the loanable funds model to show how an increase in taxes...
 6. Use the diagram of the loanable funds model to show how an increase in taxes shifts the IS curve.
Worksheet: Circular Flow Diagram Note: this is not in your text book. Research the "Circular Flow...
 Worksheet: Circular Flow Diagram Note: this is not in your text book. Research the "Circular Flow Diagram". There are a number of versions our there, but we will focus initially on what is often referred to as the Simple Circular Flow Diagram. Draw it here F/P Firme! House Holds • What does this model represent? What is it intended to show us? • There should be only two economic actors in your CFD. • What are these 2? Firmy and...
Provide definition and one example for market power, productivity, inflation, business cycle, circular flow chart and...
Provide definition and one example for market power, productivity, inflation, business cycle, circular flow chart and microeconomics.
The following diagram presents a circular-flow model of a simple economy. The outer set of arrows...
 The following diagram presents
a circular-flow model of a simple economy. The outer set of arrows
(shown in green) shows the flow of dollars, and the inner set of
arrows (shown in red) shows the corresponding flow of inputs and
outputs.
Which of the following is true regarding this economic
model?
A) While simple, the circular-flow diagram can still be useful
for the purposes of modeling how dollars and resources move
throughout an economy.
B) Because it does not take...
The following diagram presents
a circular-flow model of a simple economy. The outer set of arrows
(shown in green) shows the flow of dollars, and the inner set of
arrows (shown in red) shows the corresponding flow of inputs and
outputs.
Which of the following is true regarding this economic
model?
A) While simple, the circular-flow diagram can still be useful
for the purposes of modeling how dollars and resources move
throughout an economy.
B) Because it does not take...
1. Economic models The following diagram presents a circular-flow model of a simple economy. The outer...
 1. Economic models The following diagram presents a circular-flow model of a simple economy. The outer set of arrows (shown in green) shows the flow of dollars, and the Inner set of arrows (shown in red) shows the corresponding flow of inputs and outputs. Markets for Goods and Services Firms Households Markets for Factors of Production Which of the following is true regarding this economic model? While simple, the circular-flow diagram can still be useful for the purposes of modeling...
What does the circular flow diagram suggest about the economic impact of business expansion initiatives?
What does the circular flow diagram suggest about the economic impact of business expansion initiatives?
 6. Use the diagram of the loanable funds model to show how an increase in taxes shifts the IS curve.
 Worksheet: Circular Flow Diagram Note: this is not in your text book. Research the "Circular Flow Diagram". There are a number of versions our there, but we will focus initially on what is often referred to as the Simple Circular Flow Diagram. Draw it here F/P Firme! House Holds • What does this model represent? What is it intended to show us? • There should be only two economic actors in your CFD. • What are these 2? Firmy and...
 The following diagram presents
a circular-flow model of a simple economy. The outer set of arrows
(shown in green) shows the flow of dollars, and the inner set of
arrows (shown in red) shows the corresponding flow of inputs and
outputs.
Which of the following is true regarding this economic
model?
A) While simple, the circular-flow diagram can still be useful
for the purposes of modeling how dollars and resources move
throughout an economy.
B) Because it does not take...
The following diagram presents
a circular-flow model of a simple economy. The outer set of arrows
(shown in green) shows the flow of dollars, and the inner set of
arrows (shown in red) shows the corresponding flow of inputs and
outputs.
Which of the following is true regarding this economic
model?
A) While simple, the circular-flow diagram can still be useful
for the purposes of modeling how dollars and resources move
throughout an economy.
B) Because it does not take...
 1. Economic models The following diagram presents a circular-flow model of a simple economy. The outer set of arrows (shown in green) shows the flow of dollars, and the Inner set of arrows (shown in red) shows the corresponding flow of inputs and outputs. Markets for Goods and Services Firms Households Markets for Factors of Production Which of the following is true regarding this economic model? While simple, the circular-flow diagram can still be useful for the purposes of modeling...
Most questions answered within 3 hours.
-
What are the negative effects of abruptly stopping the use of
all fossil fuels? Give at...
asked 3 minutes ago -
Given that many conflict are the result of different parties having
different interests, is it possible...
asked 8 minutes ago -
A 750 g block can slide uniformly along the horizontal track
when a string attached to...
asked 11 minutes ago -
In 2017, Juan entered into a contract to write a book. The
publisher advanced Juan $50,000,...
asked 25 minutes ago -
Determine the number of kinds of protons in each molecule (w/
respect to NMR spectroscopy). Drawing...
asked 35 minutes ago -
A jeweler whose near point is 68 cm from his eye uses a
magnifying glass as...
asked 33 minutes ago -
A company wants to determine how many units of each of two
products, A and B,...
asked 37 minutes ago -
The blood pressure of a person changes throughout the day.
Suppose the systolic blood pressure of...
asked 46 minutes ago -
A chemistry student desired to study sulfur. Sulfur exhibited
the following characteristics with oxygen:
(a) It...
asked 41 minutes ago -
An Atwood machine is constructed of a solid-disk frictionless
pulley of mass m3 and radius R....
asked 43 minutes ago -
what are the advantages of lanthanum hexaboride over tungsten
filament for electron emission
what is the...
asked 45 minutes ago -
Question 5
Your uncle offers to sell you his vintage Rolls Royce. He
suggests a payment...
asked 50 minutes ago