Below is a table of results of E. coli grown in in nutrient broth (NB) and...
Below is a table of results of E. coli grown in in nutrient broth (NB) and minimal medium (MM) over 220 min.
| Time (min) | A600 of | |
| NB | MM | |
| 0 | 0.044 | 0.038 |
| 20 | 0.177 | 0.074 |
| 40 | 0.321 | 0.116 |
| 60 | 0.429 | 0.167 |
| 80 | 0.523 | 0.235 |
| 100 | 0.638 | 0.285 |
| 120 | 0.849 | 0.300 |
| 140 | 0.925 | 0.367 |
| 160 | 1.101 | 0.428 |
| 180 | 1.159 | 0.468 |
| 200 | 1.198 | 0.471 |
| 220 | 1.209 | 0.488 |
Using the above data, plot absorbance (log scale) versus time (linear), drawing both conditions on one set of axes.
Upload the graph as a jpg file to this assignment (an Excel graph or a photo of a manually drawn graph is acceptable).
Label your graph appropriately.
Remember, you will not get any marks if your semi-log graph is titled as "Absorbance versus time" because this is already the label of your Y and X axes.
Determine the growth rate constant for E. coli growing for each culture media. Show your calculations in the space below.
Homework Answers
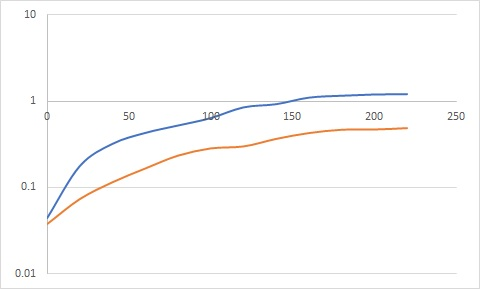
Blue- culture media 1, orange - culture media 2
culture media 1
growth rate constant (µ) = ( (log10 N - log10 N0) 2.303) / (t - t0)
= (0.321- 0.044) 2.303 /40 min
= 0.01594 min-1
culture media 2
growth rate constant (µ) = ( (log10 N - log10 N0) 2.303) / (t - t0)
= (0.523- 0.038) 2.303 /80 min
= 0.01396 min-1
Add Answer to:
Below is a table of results of E. coli grown in in
nutrient broth (NB) and...
Most questions answered within 3 hours.
-
The blues made its way into many kinds of music. Eric Clapton,
The Beatles, and Elvis...
asked 1 hour ago -
8. A wave in a string has a wave function given by: y (x, t) =...
asked 19 minutes ago -
If you’re standing at the bottom of a hill and asked to evaluate
it while being...
asked 2 hours ago -
1. Which region has taken the lead in the world of
e-waste handling?
a) European Union...
asked 2 hours ago -
A 8.15- g bullet from a 9-mm pistol has a velocity of 366.0 m/s.
It strikes...
asked 3 hours ago -
The outstanding bonds of Alpha Extracts have a yield to maturity
of 7.4 percent and a...
asked 3 hours ago -
The Problem: The Case of the Harmonizing Vacations
Your CEO is exploring partnering with a European...
asked 4 hours ago -
A chemical equation is balanced by adding coefficients in front
of some formulas so that the...
asked 4 hours ago -
From the literature (reference your sources): What are the
lattice parameters of calcite and aragonite? Why...
asked 5 hours ago -
Your system is rejecting the question am asking which is
preceded by a case study. It...
asked 5 hours ago -
3. On January 2, 2000, Larry creates a trust with himself as
trustee. Larry as trustee...
asked 5 hours ago -
A member of the volleyball team spikes the ball. During this
process, she changes the velocity...
asked 5 hours ago