please answer this in matlab so it can match the function. thank you
Homework Answers
Hello,
Please find
the answer attached as under. Please give a thumbs up
rating if you find the answer useful! Have a rocking day
ahead!
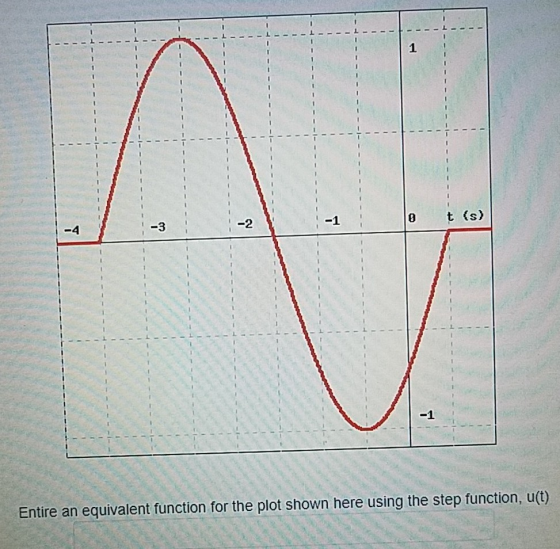
The sine wave can be repreented by the following equation : y(t) = sin(2*pi*0.25*(t-0.5)). However, the sine wave is clipped on the time axis, on either side. This is where the step function comes in. The clipped step function can be represented as x(t) = u(t+3.5) - u(t-0.5). Thus, the function becomes:
f(t) = x(t)y(t) = sin(2*pi*0.25*(t-0.5))*[u(t+3.5) - u(t-0.5)]
This is plotted in Matlab as follows:
t = -5:0.01:5;
x = double(t>=-3.5) - double(t>=0.5); % the unit step
function
y = sin(2*pi*0.25*(t-0.5)); % sine function
f = x.*y;
plot(t,f,'LineWidth',2);
grid;
xlabel('Time(s)');
ylabel('Magnitude');
Output:

*****************************************************************
PS: Please do not forget the thumbs
up
Add Answer to:
please answer this in matlab so it can match the
function. thank you
- L -...
**Using MATLAB** 0 t (s) -4 -3 -2 -1 -1 Entire an equivalent function for the plot shown here using the step function, u(t) 0 t (s) -4 -3 -2 -1 -1 Entire an equivalent function for the plot show...
 **Using MATLAB**
0 t (s) -4 -3 -2 -1 -1 Entire an equivalent function for the plot shown here using the step function, u(t)
0 t (s) -4 -3 -2 -1 -1 Entire an equivalent function for the plot shown here using the step function, u(t)
**Using MATLAB**
0 t (s) -4 -3 -2 -1 -1 Entire an equivalent function for the plot shown here using the step function, u(t)
0 t (s) -4 -3 -2 -1 -1 Entire an equivalent function for the plot shown here using the step function, u(t)
Using MATLAB 4 8 Entire an equivalent function for the plot shown here using the step function, u(t) 4 8 Entire an equivalent function for the plot shown here using the step function, u(t)
 Using MATLAB
4 8 Entire an equivalent function for the plot shown here using the step function, u(t)
4 8 Entire an equivalent function for the plot shown here using the step function, u(t)
Using MATLAB
4 8 Entire an equivalent function for the plot shown here using the step function, u(t)
4 8 Entire an equivalent function for the plot shown here using the step function, u(t)
ONLY ANSWER IF 100 PERCENT CORRECT USE MATLAB 9 8 6 3 2 t (s) 10 0 2 4 6 8 Entire an equivalent function for the plot shown here using the step function, u(t) 9 8 6 3 2 t (s) 10 0 2 4 6 8 Ent...
 ONLY ANSWER IF 100 PERCENT CORRECT
USE MATLAB
9 8 6 3 2 t (s) 10 0 2 4 6 8 Entire an equivalent function for the plot shown here using the step function, u(t)
9 8 6 3 2 t (s) 10 0 2 4 6 8 Entire an equivalent function for the plot shown here using the step function, u(t)
ONLY ANSWER IF 100 PERCENT CORRECT
USE MATLAB
9 8 6 3 2 t (s) 10 0 2 4 6 8 Entire an equivalent function for the plot shown here using the step function, u(t)
9 8 6 3 2 t (s) 10 0 2 4 6 8 Entire an equivalent function for the plot shown here using the step function, u(t)
ONLY NEED SOLUTION TO QUESTION 4 PLEASE, THANK YOU (PLEASE MAKE SURE TO PLOT THE SOLUTION IN MATLAB) Part A (Based off week 7 Workshop content) Consider the RLC circuit where R = 5, C = 1, L = 4 and...
 ONLY NEED SOLUTION TO QUESTION 4 PLEASE, THANK
YOU
(PLEASE MAKE SURE TO PLOT THE SOLUTION IN
MATLAB)
Part A (Based off week 7 Workshop content) Consider the RLC circuit where R = 5, C = 1, L = 4 and Vs = 8. 1. Use circuit analysis laws to show that the resistor's voltage and induc tor's voltage can be modelled as the system of ODEs: L RC i the system of ODEs 3. Verify your answer for question...
ONLY NEED SOLUTION TO QUESTION 4 PLEASE, THANK
YOU
(PLEASE MAKE SURE TO PLOT THE SOLUTION IN
MATLAB)
Part A (Based off week 7 Workshop content) Consider the RLC circuit where R = 5, C = 1, L = 4 and Vs = 8. 1. Use circuit analysis laws to show that the resistor's voltage and induc tor's voltage can be modelled as the system of ODEs: L RC i the system of ODEs 3. Verify your answer for question...
Please code on MATLAB and explain D) only. Thank you The block diagram of a linear...
 Please code on MATLAB and explain D) only. Thank you
The block diagram of a linear control system is shown in the Fig., where r(t) is the reference input and n(t) is the disturbance. (a) Find the steady-state value of e(t) when n(t) = 0 and r(t) tuz(t). Find the conditions on the values of a and K so that the solution is valid. N(s) R(S) E(S) S + a K(s + 3) Y(s) S (5² - 1) Controller Process...
Please code on MATLAB and explain D) only. Thank you
The block diagram of a linear control system is shown in the Fig., where r(t) is the reference input and n(t) is the disturbance. (a) Find the steady-state value of e(t) when n(t) = 0 and r(t) tuz(t). Find the conditions on the values of a and K so that the solution is valid. N(s) R(S) E(S) S + a K(s + 3) Y(s) S (5² - 1) Controller Process...
MATLAB Thank you! Exercise: Bacteria Growth and Interpretation You can see that doing this with a...
 MATLAB
Thank you!
Exercise: Bacteria Growth and Interpretation You can see that doing this with a for loop can be easier than repeatedly typing the same commands for every a value. Using a for loop also makes the desired values or parameters easier to change Consider various populations of bacteria whose populations are modelled by the function P(t) 100 e a.Sat, where P(t) is the population, t is the time in hours, and a is some positive constant. Your job...
MATLAB
Thank you!
Exercise: Bacteria Growth and Interpretation You can see that doing this with a for loop can be easier than repeatedly typing the same commands for every a value. Using a for loop also makes the desired values or parameters easier to change Consider various populations of bacteria whose populations are modelled by the function P(t) 100 e a.Sat, where P(t) is the population, t is the time in hours, and a is some positive constant. Your job...
For MATLAB users. Can you please type the answers for the MATLAB sections. Consider the RLC circuit where R - 5, C- 1, L- 4 and Vs - 8 1. Use circuit analysis laws to show that the resistor's vol...
 For MATLAB users. Can you please type the answers for the MATLAB
sections.
Consider the RLC circuit where R - 5, C- 1, L- 4 and Vs - 8 1. Use circuit analysis laws to show that the resistor's voltage and induc- tor's voltage can be modelled as the system of ODEs Vi VL RC 2. Solve the eigenvalues and eigenvectors of the coefficient matrix in the system of ODEs. 3. Verify your answer for question (2) by using the...
For MATLAB users. Can you please type the answers for the MATLAB
sections.
Consider the RLC circuit where R - 5, C- 1, L- 4 and Vs - 8 1. Use circuit analysis laws to show that the resistor's voltage and induc- tor's voltage can be modelled as the system of ODEs Vi VL RC 2. Solve the eigenvalues and eigenvectors of the coefficient matrix in the system of ODEs. 3. Verify your answer for question (2) by using the...
PLEASE USE MATLAB COMMANDS THANK YOU Use Matlab to graph the functions f(x) = 3xsin(3x) and...
 PLEASE USE MATLAB COMMANDS THANK YOU
Use Matlab to graph the functions f(x) = 3xsin(3x) and g(x)= 12 - 2x² so that you can read off the point(s) of intersection (if any), accurate up to two decimal places. 1) Write down the Matlab command(s) you used to create the x-vector. 2) Write down the Matlab command(s) you used to produce the vectors containing the f- and g-function values. 3) Write down the Matlab command(s) you used to plot the graphs....
PLEASE USE MATLAB COMMANDS THANK YOU
Use Matlab to graph the functions f(x) = 3xsin(3x) and g(x)= 12 - 2x² so that you can read off the point(s) of intersection (if any), accurate up to two decimal places. 1) Write down the Matlab command(s) you used to create the x-vector. 2) Write down the Matlab command(s) you used to produce the vectors containing the f- and g-function values. 3) Write down the Matlab command(s) you used to plot the graphs....
MATLAB question I need the code exactly as you would write it in MATLAB. thank you...
 MATLAB question I need the code
exactly as you would write it in MATLAB. thank you
1. Consider a Gaussian solution of the traveling-wave form ψ(z,t)-exp(-a(z-vt)2). The parameter values are a 1, 2. (a) Explain the physical meaning of these parameters (eg. what would happen if we took a = 10 instead?) Determine the direction of propagation of this solution: Is it traweling to the left or to the right? (2pts) (b) Write a Matlab code to plot the Gaussian...
MATLAB question I need the code
exactly as you would write it in MATLAB. thank you
1. Consider a Gaussian solution of the traveling-wave form ψ(z,t)-exp(-a(z-vt)2). The parameter values are a 1, 2. (a) Explain the physical meaning of these parameters (eg. what would happen if we took a = 10 instead?) Determine the direction of propagation of this solution: Is it traweling to the left or to the right? (2pts) (b) Write a Matlab code to plot the Gaussian...
Please answer in MATLAB, thank you! 2. Calculate the energy of time domain signal x (t) and z (t) for the range of 0SIS...
 Please answer in MATLAB, thank you!
2. Calculate the energy of time domain signal x (t) and z (t) for the range of 0SIS2.5 Also calculate the energy of these signals in frequency domain using Parseval's theorem. Plot Energy (X) and Energy (Z) as a function of frequency f in a 2xl subplot (Energy vs frequency plot is know as energy spectrum of a signal).
2. Calculate the energy of time domain signal x (t) and z (t) for the...
Please answer in MATLAB, thank you!
2. Calculate the energy of time domain signal x (t) and z (t) for the range of 0SIS2.5 Also calculate the energy of these signals in frequency domain using Parseval's theorem. Plot Energy (X) and Energy (Z) as a function of frequency f in a 2xl subplot (Energy vs frequency plot is know as energy spectrum of a signal).
2. Calculate the energy of time domain signal x (t) and z (t) for the...
 **Using MATLAB**
0 t (s) -4 -3 -2 -1 -1 Entire an equivalent function for the plot shown here using the step function, u(t)
0 t (s) -4 -3 -2 -1 -1 Entire an equivalent function for the plot shown here using the step function, u(t)
**Using MATLAB**
0 t (s) -4 -3 -2 -1 -1 Entire an equivalent function for the plot shown here using the step function, u(t)
0 t (s) -4 -3 -2 -1 -1 Entire an equivalent function for the plot shown here using the step function, u(t)
 Using MATLAB
4 8 Entire an equivalent function for the plot shown here using the step function, u(t)
4 8 Entire an equivalent function for the plot shown here using the step function, u(t)
Using MATLAB
4 8 Entire an equivalent function for the plot shown here using the step function, u(t)
4 8 Entire an equivalent function for the plot shown here using the step function, u(t)
 ONLY ANSWER IF 100 PERCENT CORRECT
USE MATLAB
9 8 6 3 2 t (s) 10 0 2 4 6 8 Entire an equivalent function for the plot shown here using the step function, u(t)
9 8 6 3 2 t (s) 10 0 2 4 6 8 Entire an equivalent function for the plot shown here using the step function, u(t)
ONLY ANSWER IF 100 PERCENT CORRECT
USE MATLAB
9 8 6 3 2 t (s) 10 0 2 4 6 8 Entire an equivalent function for the plot shown here using the step function, u(t)
9 8 6 3 2 t (s) 10 0 2 4 6 8 Entire an equivalent function for the plot shown here using the step function, u(t)
 ONLY NEED SOLUTION TO QUESTION 4 PLEASE, THANK
YOU
(PLEASE MAKE SURE TO PLOT THE SOLUTION IN
MATLAB)
Part A (Based off week 7 Workshop content) Consider the RLC circuit where R = 5, C = 1, L = 4 and Vs = 8. 1. Use circuit analysis laws to show that the resistor's voltage and induc tor's voltage can be modelled as the system of ODEs: L RC i the system of ODEs 3. Verify your answer for question...
ONLY NEED SOLUTION TO QUESTION 4 PLEASE, THANK
YOU
(PLEASE MAKE SURE TO PLOT THE SOLUTION IN
MATLAB)
Part A (Based off week 7 Workshop content) Consider the RLC circuit where R = 5, C = 1, L = 4 and Vs = 8. 1. Use circuit analysis laws to show that the resistor's voltage and induc tor's voltage can be modelled as the system of ODEs: L RC i the system of ODEs 3. Verify your answer for question...
 Please code on MATLAB and explain D) only. Thank you
The block diagram of a linear control system is shown in the Fig., where r(t) is the reference input and n(t) is the disturbance. (a) Find the steady-state value of e(t) when n(t) = 0 and r(t) tuz(t). Find the conditions on the values of a and K so that the solution is valid. N(s) R(S) E(S) S + a K(s + 3) Y(s) S (5² - 1) Controller Process...
Please code on MATLAB and explain D) only. Thank you
The block diagram of a linear control system is shown in the Fig., where r(t) is the reference input and n(t) is the disturbance. (a) Find the steady-state value of e(t) when n(t) = 0 and r(t) tuz(t). Find the conditions on the values of a and K so that the solution is valid. N(s) R(S) E(S) S + a K(s + 3) Y(s) S (5² - 1) Controller Process...
 MATLAB
Thank you!
Exercise: Bacteria Growth and Interpretation You can see that doing this with a for loop can be easier than repeatedly typing the same commands for every a value. Using a for loop also makes the desired values or parameters easier to change Consider various populations of bacteria whose populations are modelled by the function P(t) 100 e a.Sat, where P(t) is the population, t is the time in hours, and a is some positive constant. Your job...
MATLAB
Thank you!
Exercise: Bacteria Growth and Interpretation You can see that doing this with a for loop can be easier than repeatedly typing the same commands for every a value. Using a for loop also makes the desired values or parameters easier to change Consider various populations of bacteria whose populations are modelled by the function P(t) 100 e a.Sat, where P(t) is the population, t is the time in hours, and a is some positive constant. Your job...
 For MATLAB users. Can you please type the answers for the MATLAB
sections.
Consider the RLC circuit where R - 5, C- 1, L- 4 and Vs - 8 1. Use circuit analysis laws to show that the resistor's voltage and induc- tor's voltage can be modelled as the system of ODEs Vi VL RC 2. Solve the eigenvalues and eigenvectors of the coefficient matrix in the system of ODEs. 3. Verify your answer for question (2) by using the...
For MATLAB users. Can you please type the answers for the MATLAB
sections.
Consider the RLC circuit where R - 5, C- 1, L- 4 and Vs - 8 1. Use circuit analysis laws to show that the resistor's voltage and induc- tor's voltage can be modelled as the system of ODEs Vi VL RC 2. Solve the eigenvalues and eigenvectors of the coefficient matrix in the system of ODEs. 3. Verify your answer for question (2) by using the...
 PLEASE USE MATLAB COMMANDS THANK YOU
Use Matlab to graph the functions f(x) = 3xsin(3x) and g(x)= 12 - 2x² so that you can read off the point(s) of intersection (if any), accurate up to two decimal places. 1) Write down the Matlab command(s) you used to create the x-vector. 2) Write down the Matlab command(s) you used to produce the vectors containing the f- and g-function values. 3) Write down the Matlab command(s) you used to plot the graphs....
PLEASE USE MATLAB COMMANDS THANK YOU
Use Matlab to graph the functions f(x) = 3xsin(3x) and g(x)= 12 - 2x² so that you can read off the point(s) of intersection (if any), accurate up to two decimal places. 1) Write down the Matlab command(s) you used to create the x-vector. 2) Write down the Matlab command(s) you used to produce the vectors containing the f- and g-function values. 3) Write down the Matlab command(s) you used to plot the graphs....
 MATLAB question I need the code
exactly as you would write it in MATLAB. thank you
1. Consider a Gaussian solution of the traveling-wave form ψ(z,t)-exp(-a(z-vt)2). The parameter values are a 1, 2. (a) Explain the physical meaning of these parameters (eg. what would happen if we took a = 10 instead?) Determine the direction of propagation of this solution: Is it traweling to the left or to the right? (2pts) (b) Write a Matlab code to plot the Gaussian...
MATLAB question I need the code
exactly as you would write it in MATLAB. thank you
1. Consider a Gaussian solution of the traveling-wave form ψ(z,t)-exp(-a(z-vt)2). The parameter values are a 1, 2. (a) Explain the physical meaning of these parameters (eg. what would happen if we took a = 10 instead?) Determine the direction of propagation of this solution: Is it traweling to the left or to the right? (2pts) (b) Write a Matlab code to plot the Gaussian...
 Please answer in MATLAB, thank you!
2. Calculate the energy of time domain signal x (t) and z (t) for the range of 0SIS2.5 Also calculate the energy of these signals in frequency domain using Parseval's theorem. Plot Energy (X) and Energy (Z) as a function of frequency f in a 2xl subplot (Energy vs frequency plot is know as energy spectrum of a signal).
2. Calculate the energy of time domain signal x (t) and z (t) for the...
Please answer in MATLAB, thank you!
2. Calculate the energy of time domain signal x (t) and z (t) for the range of 0SIS2.5 Also calculate the energy of these signals in frequency domain using Parseval's theorem. Plot Energy (X) and Energy (Z) as a function of frequency f in a 2xl subplot (Energy vs frequency plot is know as energy spectrum of a signal).
2. Calculate the energy of time domain signal x (t) and z (t) for the...
Most questions answered within 3 hours.
-
if we subtract 1000 from 0001 is there overflow? (binary)
asked 3 minutes ago -
Hello, I need help with the function below, The language I am
using is Ocaml
open...
asked 4 minutes ago -
Explain how the presence of glucose represses the gal structural
genes?
asked 12 minutes ago -
For the reaction CaI2+2AgNO3⟶2AgI+Ca(NO3)2 how many grams of
silver iodide, AgI, are produced from 56.5 g...
asked 23 minutes ago -
Write an equation for hydrolysis via acid catalysis.
Using ethyl acetate, ethyl benzoate, ethyl formate or...
asked 31 minutes ago -
Only one graph is needed.
(a) Draw a Supply Curve and the Demand Curve for the...
asked 34 minutes ago -
Fill in the blanks and please show how you arrived at numerical
answers
. The...
asked 34 minutes ago -
91. If the half – life of a sample of radioactive
material is 60 days, what...
asked 41 minutes ago -
White light (380nm-750nm) strikes a diffraction grating (420
lines/mm) at normal incidence. What is the highest-order...
asked 51 minutes ago -
1) Explain what is meant by a good being "excludable."?
2) Explain what is meant by...
asked 50 minutes ago -
I need help with this question:
Describe in detail at least two factors that stimulated American...
asked 57 minutes ago -
Calculate the Boyle temperature for helium assuming it follows
the Berthelot equation of state.
asked 58 minutes ago