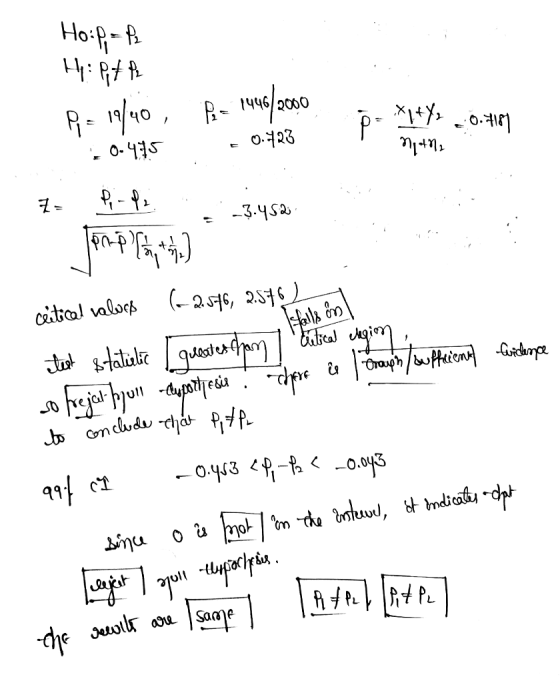
![This Question: 1 pt 9 of 15 (0 complete) ? This Test: 17 pts possible Two different simple random samples are drawn from two different populations. The first sample consists of 40 people with 19 having a common attribute. The second sample consists of 2000 people with 1446 of them having the same common attribute. Compare the results from a hypothesis test of P P2 (with a 0.01 significance level) and a 99% confidence interval estimate of p, P2. What are the null and alternative hypotheses for the hypothesis test? Hi P1 P2 H1 : p1 # p2 H1:P1 P2 H1:P1 P2 Identify the test statistic. Round to two decimal places as needed.) Identify the critical value(s). Round to three decimal places as needed. Use a comma to separate answers as needed.) What is the conclusion based on the hypothesis test? The test statistic is the critical region, so the null hypothesis. There is evidence to conclude that p, P2 The 99% confidence interval is [] (p1-p2) «D Round to three decimal places as needed.) What is the conclusion based on the confidence interval? Since 0 isL ?inthe interval, it indicates to the null hypothesis. How do the results from the hypothesis test and the confidence interval compare? Tho results arsinc tho oteas tast suogests that p, and the contideno intarval suggostthatP The results are](http://img.homeworklib.com/questions/a6582220-7969-11eb-a82e-351b326814f7.png?x-oss-process=image/resize,w_560)
Homework Answers
Please rate my answer,if it is helpful
Thanks you
Add Answer to:
This Question: 1 pt 9 of 15 (0 complete) ? This Test: 17 pts possible Two...
Two different simple random samples are drawn from two different populations. The first sample consists of...
 Two different simple random samples are drawn from two different populations. The first sample consists of 40 people with 20 having a common attribute. The second sam ple consists of 2200 people with 1570 of them having the same common attribute. Compare the results from a hypothesis test of p1 = p2 (with a 0.05 significance level) and a 95% confidence interval estimate of p1-p2 What are the null and alternative hypotheses for the hypothesis test? A. Ho : p1...
This Question: 1 pt Question Help samples are drewn from two different populations. The frst sample...
 This Question: 1 pt Question Help samples are drewn from two different populations. The frst sample consists of 30 people with 15 having a common attribute. The Two different simple random samples are drawn from two dift second sample consists of 2000 people with 1416 of them having the same common attribute. Compare the reaul significance level) and a 95% confidence interval estimate of pi-p2 What are the null and alternative hypotheses for the hypothesis test? H1 P1 P2 Identify...
Two different simple random samples are drawn from two different populations. The first sample consists of 40 people wit...
Two different simple random samples are drawn from two different populations. The first sample consists of 40 people with 21 having a common attribute. The second sample consists of 2000 people with 1429 of them having the same common attribute. Compare the results from a hypothesis test of p 1=p2 (with a 0.05 significance level) and a 95% confidence interval estimate of p 1-p2. What are the null and alternative hypotheses for the hypothesis test? What is the test statistic?...
Two different simple random samples are drawn from two different populations. The first sample consists of...
Two different simple random samples are drawn from two different populations. The first sample consists of 40 people with 22 having a common attribute. The second sample consists of 2000 people with 1430 of them having the same common attribute. Compare the results from a hypothesis test of p1equals=p 2 (with a 0.01 significance level) and a 99% confidence interval estimate of p1−p 2 a) identify test statistic b) identify critical value c)What is the conclusion based on the hypothesis...
This Question: 1 pt | 20 of 20 (0 complete) ? This Test: 20 pts possible...
 This Question: 1 pt | 20 of 20 (0 complete) ? This Test: 20 pts possible In a study of pregnant women and their ability to correctly predict the sex of their baby, 57 of the pregnant women had 12 years of education or less, and 43.9% of these women correctly predicted the sex of their baby. Use a 0.05 significance level to test the claim that these women have an ability to predict the sex of their baby equivalent...
#7 Two different simple random samples consists of 30 people with 14 having a common attribute....
 #7
Two different simple random samples consists of 30 people with 14 having a common attribute. The second sample consists of 2000 people with 1460 of them having the same common attribute. Compare the results from a hypothesis test of p, =p2 (with a 0.05 significance level) and a 95% confidence interval estimate of are drawn from two different populations. The first sample P1-P2- Identify the test statistic. (Round to two decimal places as needed.) Enter your answęr in the...
#7
Two different simple random samples consists of 30 people with 14 having a common attribute. The second sample consists of 2000 people with 1460 of them having the same common attribute. Compare the results from a hypothesis test of p, =p2 (with a 0.05 significance level) and a 95% confidence interval estimate of are drawn from two different populations. The first sample P1-P2- Identify the test statistic. (Round to two decimal places as needed.) Enter your answęr in the...
The options for the final part are A.(less than/greater than) B.(Fail to reject, Reject) C.(sufficent/insufficent) A...
 The options for the final part
are A.(less than/greater than) B.(Fail to reject, Reject)
C.(sufficent/insufficent)
A newspaper published an article about a study in which researchers subjected laboratory gloves to stress. Among 288 vinyl gloves, 70% leaked viruses. Among 288 latex gloves, 6% leaked viruses. See the accompanying display of the technology results. Using a 0.10 significance level, test the claim that vinyl gloves have a greater virus leak rate than latex gloves. Let vinyl gloves be population 1 Click...
The options for the final part
are A.(less than/greater than) B.(Fail to reject, Reject)
C.(sufficent/insufficent)
A newspaper published an article about a study in which researchers subjected laboratory gloves to stress. Among 288 vinyl gloves, 70% leaked viruses. Among 288 latex gloves, 6% leaked viruses. See the accompanying display of the technology results. Using a 0.10 significance level, test the claim that vinyl gloves have a greater virus leak rate than latex gloves. Let vinyl gloves be population 1 Click...
Since an instant replay system for tennis was introduced at a major tournament, men challenged 1413...
Since an instant replay system for tennis was introduced at a major tournament, men challenged 1413 referee calls, with the result that 416 of the calls were overturned. Women challenged 776 referee calls, and 225 of the calls were overturned. Use a 0.01 significance level to test the claim that men and women have equal success in challenging calls. Complete parts (a) through (c) below. a. Test the claim using a hypothesis test. Consider the first sample to be the...
1. Identify the test statistic. Z=_____(Round to two decimal places as needed.) Identify the P-value. P=_____(Round...
 1.
Identify the test
statistic.
Z=_____(Round to two decimal places as needed.)
Identify the P-value.
P=_____(Round to three decimal places as needed.)
What is the conclusion based on the hypothesis test?
The P-value is (1)_____ the significance level of α=0.05, so
(2)_____ the null hypothesis. There (3)_____ evidence to warrant
rejection of the claim that women and men have equal success in
challenging calls.
b. Test the claim by constructing an appropriate confidence
interval.
The 95% or 99% confidence interval...
1.
Identify the test
statistic.
Z=_____(Round to two decimal places as needed.)
Identify the P-value.
P=_____(Round to three decimal places as needed.)
What is the conclusion based on the hypothesis test?
The P-value is (1)_____ the significance level of α=0.05, so
(2)_____ the null hypothesis. There (3)_____ evidence to warrant
rejection of the claim that women and men have equal success in
challenging calls.
b. Test the claim by constructing an appropriate confidence
interval.
The 95% or 99% confidence interval...
Conduct the following test at the α = 0.05 level of significance by determining (a) the...
Conduct the following test at the α = 0.05 level of significance by determining (a) the null and alternative hypotheses, (b) the test statistic, and (c) the P-value. Assume that the samples were obtained independently using simple random sampling. Test whether p1≠p2. Sample data are x1=30, n1=254, x2=36, and n2=302. (a) Determine the null and alternative hypotheses. Choose the correct answer below. A. H0: p1=0 versus H1: p1=0 B. H0: p1=p2 versus H1: p1<p2 C. H0: p1=p2 versus H1: p1>p2...
 Two different simple random samples are drawn from two different populations. The first sample consists of 40 people with 20 having a common attribute. The second sam ple consists of 2200 people with 1570 of them having the same common attribute. Compare the results from a hypothesis test of p1 = p2 (with a 0.05 significance level) and a 95% confidence interval estimate of p1-p2 What are the null and alternative hypotheses for the hypothesis test? A. Ho : p1...
 This Question: 1 pt Question Help samples are drewn from two different populations. The frst sample consists of 30 people with 15 having a common attribute. The Two different simple random samples are drawn from two dift second sample consists of 2000 people with 1416 of them having the same common attribute. Compare the reaul significance level) and a 95% confidence interval estimate of pi-p2 What are the null and alternative hypotheses for the hypothesis test? H1 P1 P2 Identify...
 This Question: 1 pt | 20 of 20 (0 complete) ? This Test: 20 pts possible In a study of pregnant women and their ability to correctly predict the sex of their baby, 57 of the pregnant women had 12 years of education or less, and 43.9% of these women correctly predicted the sex of their baby. Use a 0.05 significance level to test the claim that these women have an ability to predict the sex of their baby equivalent...
 #7
Two different simple random samples consists of 30 people with 14 having a common attribute. The second sample consists of 2000 people with 1460 of them having the same common attribute. Compare the results from a hypothesis test of p, =p2 (with a 0.05 significance level) and a 95% confidence interval estimate of are drawn from two different populations. The first sample P1-P2- Identify the test statistic. (Round to two decimal places as needed.) Enter your answęr in the...
#7
Two different simple random samples consists of 30 people with 14 having a common attribute. The second sample consists of 2000 people with 1460 of them having the same common attribute. Compare the results from a hypothesis test of p, =p2 (with a 0.05 significance level) and a 95% confidence interval estimate of are drawn from two different populations. The first sample P1-P2- Identify the test statistic. (Round to two decimal places as needed.) Enter your answęr in the...
 The options for the final part
are A.(less than/greater than) B.(Fail to reject, Reject)
C.(sufficent/insufficent)
A newspaper published an article about a study in which researchers subjected laboratory gloves to stress. Among 288 vinyl gloves, 70% leaked viruses. Among 288 latex gloves, 6% leaked viruses. See the accompanying display of the technology results. Using a 0.10 significance level, test the claim that vinyl gloves have a greater virus leak rate than latex gloves. Let vinyl gloves be population 1 Click...
The options for the final part
are A.(less than/greater than) B.(Fail to reject, Reject)
C.(sufficent/insufficent)
A newspaper published an article about a study in which researchers subjected laboratory gloves to stress. Among 288 vinyl gloves, 70% leaked viruses. Among 288 latex gloves, 6% leaked viruses. See the accompanying display of the technology results. Using a 0.10 significance level, test the claim that vinyl gloves have a greater virus leak rate than latex gloves. Let vinyl gloves be population 1 Click...
 1.
Identify the test
statistic.
Z=_____(Round to two decimal places as needed.)
Identify the P-value.
P=_____(Round to three decimal places as needed.)
What is the conclusion based on the hypothesis test?
The P-value is (1)_____ the significance level of α=0.05, so
(2)_____ the null hypothesis. There (3)_____ evidence to warrant
rejection of the claim that women and men have equal success in
challenging calls.
b. Test the claim by constructing an appropriate confidence
interval.
The 95% or 99% confidence interval...
1.
Identify the test
statistic.
Z=_____(Round to two decimal places as needed.)
Identify the P-value.
P=_____(Round to three decimal places as needed.)
What is the conclusion based on the hypothesis test?
The P-value is (1)_____ the significance level of α=0.05, so
(2)_____ the null hypothesis. There (3)_____ evidence to warrant
rejection of the claim that women and men have equal success in
challenging calls.
b. Test the claim by constructing an appropriate confidence
interval.
The 95% or 99% confidence interval...
Most questions answered within 3 hours.
-
Using MARS simulator, write MIPS programs according to
the following scenarios: Receive a positive integer number...
asked 44 minutes ago -
An object in front of a concave mirror has a real image that is
11.5 cm...
asked 58 minutes ago -
Consider the reaction, C3 H8 + O2 --> CO2 + H2O. How many
moles of O2...
asked 2 hours ago -
You and your opponent both roll a fair die. If you both roll the
same number,...
asked 2 hours ago -
In a study of the accuracy of fast food drive-through orders,
Restaurant A had 257 accurate...
asked 2 hours ago -
Identify and describe in detail the four categories of
institutions that could be included in a...
asked 3 hours ago -
In python
class Customer:
def __init__(self, customer_id, last_name, first_name, phone_number, address):
self._customer_id = int(customer_id)
self._last_name =...
asked 3 hours ago -
What is an example of a limitation in implementing a new
ERP system and how it...
asked 3 hours ago -
In a section of 9.7cm of an artery with a radius of 2.6mm there
is a...
asked 3 hours ago -
the two carboxylic acid groups of aspartic acid have different
acidities with pKa values of 2.1...
asked 3 hours ago -
Would CuCO3 aqueous salt combined with calcium chloride
form a solid precipitate? If so, what would...
asked 3 hours ago -
How do ECM Solutions assist in embedding a culture of continuous
improvement in an organization? (Project...
asked 3 hours ago