
Homework Answers
Answer a)
Step 1: Find ?/2
Level of Confidence = 95%
? = 100% - (Level of Confidence) = 5%
?/2 = 2.5% = 0.025
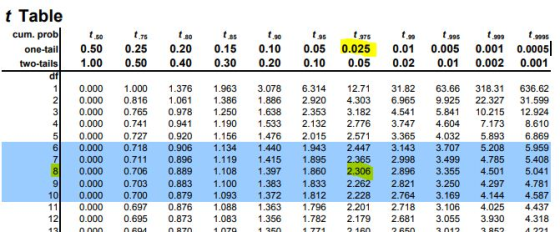
Step 2: Find t?/2
Calculate t?/2 by using t-distribution with degrees of
freedom (DF) as n - 1 = 9 - 1 = 8 and ?/2 = 0.025 as right-tailed
area and left-tailed area.
t?/2 = 2.306 (Obtained using t distribution table. Screenshot attached)
Step 3: Calculate Confidence Interval
Confidence Formula: [d? - t?/2•(sd/?n) , d? +
t?/2•(sd/?n)]
t?/2 = 2.306, sd = 4.177912, n = 9, d? =
-7.60
Lower Bound = d? - t?/2•(sd/?n) = -7.6 -
(2.306)(4.177912/?9) = -10.811
Upper Bound = d? + t?/2•(sd/?n) = -7.6 +
(2.306)(4.177912/?9) = -4.389
Confidence Interval = (-10.811, -4.389)
Interpretation:
Since we do not know if the confidence interval (-10.811, -4.3886479412) contains the true mean difference ?d or not, we are only 95% confident that (-10.811, -4.389) contains the true mean difference.
Answer b)
Step 1: Formulate hypothesis
H0: ?d = 0 (There is no difference in
completion time)
H1: ?d < 0 (The completion time decreased,
with higher level of illumination)
Step 2: Input ? (level of significance of hypothesis test).
? = 0.05 (Note: ? = level of significance of hypothesis test =
probability of making Type I error.)
Step 3: Calculate Test Statistic.
d? (sample mean) = -7.60
sd = 4.177912
n (sample size) = 9
 (Note: From Step 1, we have H0: ?d = 0;
therefore set ?d = 0)
(Note: From Step 1, we have H0: ?d = 0;
therefore set ?d = 0)
Test statistic t = (-7.60-0)/(4.177912/SQRT(9))
Test statistic t = -5.4573
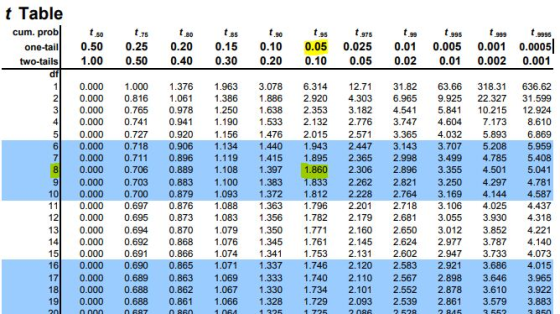
Step 4: Find Critical Value and Rejection Region
t? is the t-score corresponding to the left-tailed area. Degree of freedom = 9 - 1 = 8
Critical Value is -1.860 (Obtained using t distribution table. Screenshot attached)
Rejection Region: Reject Null Hypothesis If Test statistic < Critical Value
Step 5: Make Decision
Test statistic t = -5.4573
Critical Value is -1.860
In this case, test statistic (-5.4573) is less Critical Value (-1.860) so we reject null hypothesis.
Conclusion: There is sufficient evidence to support the claim that the higher level of illumination decreases the time for task completion.
Answer c)
In statistical hypothesis testing, a type I error is the rejection of a true null hypothesis while a type II error is failing to reject a false null hypothesis. In this case, as we have rejected the null hypothesis, so Type I error could have been made in context of problem.
Add Answer to:
(2) In an experiment designed to study effects of illumination level on task performance2, subjects were...
Most questions answered within 3 hours.
-
Compile a list (7 or more) of other commands useful for
navigating or manipulating the UNIX/Linux...
asked 2 minutes ago -
How many grams of PbBr2 will precipitate when excess CrBr3
solution is added to 61.0 mL...
asked 5 minutes ago -
If I was given the address of 134.15.0.0/16 from my ISP and I
wanted to use...
asked 9 minutes ago -
What is the pH of the solution that results of dissolving 1.74g
of sodium hydroxide in...
asked 13 minutes ago -
Given a standardized normal distribution (with μ = 0 and a σ =
1), what is...
asked 51 minutes ago -
Given the following information:
acetic acid
CH3COOH
Ka = 1.8×10⁻⁵
triethylamine
(C2H5)3N
Kb = 5.2×10⁻⁴
(1)...
asked 37 minutes ago -
Potassium permanganate(KMNO4)is has a solubility of 6.4 g/ 100 g
of water at 20ºC, and 250...
asked 34 minutes ago -
51.
As the marginal propensity to expend rises, the multiplier:
decreases.
is impossible to determine.
increases....
asked 40 minutes ago -
The Baldwin Company currently has the following balances on their
balance sheet:
Total
Liabilities
$69,309
Common...
asked 43 minutes ago -
A quiet town in Kansas has 10 people, all of whom have the same
preferences. There...
asked 49 minutes ago -
Summarize what an organization needs from a leader.
a. Analyze what might happen to an organization...
asked 52 minutes ago -
How would one critically evaluate an organizations marketing
strategies from the viewpoint of its consumers, as...
asked 50 minutes ago