


Homework Answers
![That is, 0.5l-p 0:55 - Posle 0.51 < 500.55) P-P SECB) seco) PCIP OSI-0.53 0.545-0.53 222 0.025 0.005 P Core - PEo.SC2 < 0.8]](http://img.homeworklib.com/questions/ca5923c0-837b-11eb-b0e0-75941fce6069.png?x-oss-process=image/resize,w_560)
![Consider P( 6.44 < ] -PC on 044-0.53 C6Q 20.53 cza 0.025 cicas Standardisatio p(-3.6C2C 3,6] = P[203.6] - P[22-3.6] 0.9998- 0](http://img.homeworklib.com/questions/cafc7ca0-837b-11eb-9e32-1558076816c9.png?x-oss-process=image/resize,w_560) With the given data, we can see
that the sample proportion follow Normal distribution.
With the given data, we can see
that the sample proportion follow Normal distribution.
About 99.96% of the data fall within 0.09 of the population proportion. Thus, sample proportion greater than 0.62 has very little chance of 0.04%.
Add Answer to:
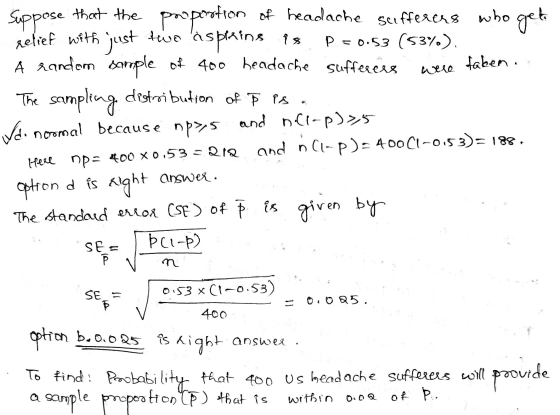
The following 5 questions are based on this information. The proportion of headache sufferers who get...
The following 5 questions are based on this information. Census indicates that the proportion of adult...
The following 5 questions are based on this information. Census indicates that the proportion of adult men in the United States is 49% (p=0.49). We plan to take a random sample of 300 U.S. adults. 1) The sampling distribution of p-bar is Select one: a. normal because np≥5 and n(1−p)≥5 b. normal because np≤5 and n(1−p)≤5 c. not normal because the sample size is too small d. not normal because np≤5 2) The standard error (SE) of p-bar is Select one: a. 0.001...
(1 point) A manufacturer of aspirin claims that the proportion of headache sufferers who get relief...
 (1 point) A manufacturer of aspirin claims that the proportion of headache sufferers who get relief with just two aspirins is 62.3 %. What is the probability that in a random sample of 580 headache sufferers, less than 58.2 % obtain relief? Probability
According to a study, the proportion of people who are satisfied with the way things are...
 According to a study, the proportion of people who are satisfied with the way things are going in their lives is 0.82. Suppose that a random sample of 100 people is obtained. Complete parts (a) through (e) below. Click here to view the standard normal distribution table (page 1). Click here to view the standard normal distribution table (page 2). O A. The response is quantitative because the responses can be measured numerically and the values added or subtracted, providing...
According to a study conducted by an organization, the proportion of Americans who were afraid to...
 According to a study conducted by an organization, the proportion of Americans who were afraid to fly in 2006 was 0.10. A random sample of 1,100 Americans results in 121 indicating that they are afraid to fly. Explain why this is not necessarily evidence that the proportion of Americans who are afraid to fly has increased Click here to view the standard normal distribution table (page 1). Click here to view the standard normal distribution table (page 2). Select the...
According to a study conducted by an organization, the proportion of Americans who were afraid to...
 According to a study conducted by an organization, the proportion of Americans who were afraid to fly in 2006 was 0.10. A random sample of 1,200 Americans results in 108 indicating that they are afraid to fly. Explain why this is not necessarily evidence that the proportion of Americans who are afraid to fly has decreased. Click here to view the standard normal distribution table (page 1). Click here to view the standard normal distribution table (page 2). Select the...
The following 5 questions are based on this information. In a random sample of 225 individual...
 The following 5 questions are based on this information. In a random sample of 225 individual tax returns in 2010, 72% ( = 0.72) were filed electronically. The goal is to construct a 90% confidence interval of the proportion (p) of all individual tax returns that were filed electronically in 2010. The standard error (SE) of p is Select one: O a. 0.05 O b. 0.20 O c.0.03 O d. 0.72 The critical value (CV) needed for the 90% confidence...
According to a study conducted by a statistical organization, the proportion of people who are satisfied...
 According to a study conducted by a statistical organization, the proportion of people who are satisfied with the way things are going in their lives is 0.80. Suppose that a random sample of 100 people is obtained Complete parts (a) through e) below (a) Suppose the random sample of 100 people is asked, "Are you satisfied with the way things are going in your life" is the response to this question qualitative or quantitative? Explain O A The response is...
According to a study conducted by an organization, the proportion of Americans who were afraid to...
 According to a study conducted by an organization, the proportion of Americans who were afraid to fly in 2006 was 0.10. A random sample of 1,400 Americans results in 154 indicating that they are afraid to fly. Explain why this is not necessarily evidence that the proportion of Americans who are afraid to fly has increased. Select the correct choice below and, if necessary, fill in the answer box to complete your choice. , which O A. This is not...
An insurance company wants to know the proportion of clients who have had claims within the...
 An insurance company wants to know the proportion of clients who have had claims within the last year. They randomly select 100 clients from a database of all clients and checks their basic information. They find that 5% of the clients had claims within the last year. Can we create a confidence interval for the relevant parameter? Select one: O a. Yes. b. No, because it wasn't a random sample. c. No, because n(p-hat) < 10 or n(q-hat) < 10....
8.2 Fill in the blanks to complete the following statements. (a) For the shape of the...
 8.2
Fill in the blanks to complete the following statements. (a) For the shape of the distribution of the sample proportion to be approximately normal, it is required that np(1-P) (b) Suppose the proportion of a population that has a certain characteristic is 0.65. The mean of the sampling distribution of p from this population is hp According to a study conducted by a statistical organization, the proportion of people who are satisfied with the way things are going in...
8.2
Fill in the blanks to complete the following statements. (a) For the shape of the distribution of the sample proportion to be approximately normal, it is required that np(1-P) (b) Suppose the proportion of a population that has a certain characteristic is 0.65. The mean of the sampling distribution of p from this population is hp According to a study conducted by a statistical organization, the proportion of people who are satisfied with the way things are going in...
 (1 point) A manufacturer of aspirin claims that the proportion of headache sufferers who get relief with just two aspirins is 62.3 %. What is the probability that in a random sample of 580 headache sufferers, less than 58.2 % obtain relief? Probability
 According to a study, the proportion of people who are satisfied with the way things are going in their lives is 0.82. Suppose that a random sample of 100 people is obtained. Complete parts (a) through (e) below. Click here to view the standard normal distribution table (page 1). Click here to view the standard normal distribution table (page 2). O A. The response is quantitative because the responses can be measured numerically and the values added or subtracted, providing...
 According to a study conducted by an organization, the proportion of Americans who were afraid to fly in 2006 was 0.10. A random sample of 1,100 Americans results in 121 indicating that they are afraid to fly. Explain why this is not necessarily evidence that the proportion of Americans who are afraid to fly has increased Click here to view the standard normal distribution table (page 1). Click here to view the standard normal distribution table (page 2). Select the...
 According to a study conducted by an organization, the proportion of Americans who were afraid to fly in 2006 was 0.10. A random sample of 1,200 Americans results in 108 indicating that they are afraid to fly. Explain why this is not necessarily evidence that the proportion of Americans who are afraid to fly has decreased. Click here to view the standard normal distribution table (page 1). Click here to view the standard normal distribution table (page 2). Select the...
 The following 5 questions are based on this information. In a random sample of 225 individual tax returns in 2010, 72% ( = 0.72) were filed electronically. The goal is to construct a 90% confidence interval of the proportion (p) of all individual tax returns that were filed electronically in 2010. The standard error (SE) of p is Select one: O a. 0.05 O b. 0.20 O c.0.03 O d. 0.72 The critical value (CV) needed for the 90% confidence...
 According to a study conducted by a statistical organization, the proportion of people who are satisfied with the way things are going in their lives is 0.80. Suppose that a random sample of 100 people is obtained Complete parts (a) through e) below (a) Suppose the random sample of 100 people is asked, "Are you satisfied with the way things are going in your life" is the response to this question qualitative or quantitative? Explain O A The response is...
 According to a study conducted by an organization, the proportion of Americans who were afraid to fly in 2006 was 0.10. A random sample of 1,400 Americans results in 154 indicating that they are afraid to fly. Explain why this is not necessarily evidence that the proportion of Americans who are afraid to fly has increased. Select the correct choice below and, if necessary, fill in the answer box to complete your choice. , which O A. This is not...
 An insurance company wants to know the proportion of clients who have had claims within the last year. They randomly select 100 clients from a database of all clients and checks their basic information. They find that 5% of the clients had claims within the last year. Can we create a confidence interval for the relevant parameter? Select one: O a. Yes. b. No, because it wasn't a random sample. c. No, because n(p-hat) < 10 or n(q-hat) < 10....
 8.2
Fill in the blanks to complete the following statements. (a) For the shape of the distribution of the sample proportion to be approximately normal, it is required that np(1-P) (b) Suppose the proportion of a population that has a certain characteristic is 0.65. The mean of the sampling distribution of p from this population is hp According to a study conducted by a statistical organization, the proportion of people who are satisfied with the way things are going in...
8.2
Fill in the blanks to complete the following statements. (a) For the shape of the distribution of the sample proportion to be approximately normal, it is required that np(1-P) (b) Suppose the proportion of a population that has a certain characteristic is 0.65. The mean of the sampling distribution of p from this population is hp According to a study conducted by a statistical organization, the proportion of people who are satisfied with the way things are going in...
Most questions answered within 3 hours.
-
Humans have used horses for transportation for millions of
years. Therefore, they will use horses for...
asked 11 minutes ago -
The following are the Jensen Corporation's unit costs of making
and selling an item at a...
asked 46 minutes ago -
Does direct Medicare reimbursement of Advanced practice nurses
increase access to their services?
asked 1 hour ago -
List and explain why a company would choose to use a
published
compensation survey vs. creating...
asked 1 hour ago -
A discrete random variable X can take values from 1 to 10. Find
the variance of...
asked 1 hour ago -
The primary financial goal of a corporation is to maximize:
shareholders wealth.
earnings per share.
stock...
asked 2 hours ago -
determine whether the vectors u=(1,2,3,), v=(-2,1,0) and
w=(1,0,1) are linearly dependent or independent.
asked 2 hours ago -
python
Define a function called print_values which takes a dictionary
object as a parameter. The function...
asked 3 hours ago -
In Chapter 1 you created a program named Triangle in
which you displayed a seven-line triangle...
asked 3 hours ago -
Research question: What are the differences between separately
stated and non separately stated transactions in an...
asked 3 hours ago -
By using Arduino write a code that connects two LEDs to two
push-buttons. Each button controls...
asked 4 hours ago -
Bank of America has bonds that pay a coupon interest rate of 5.5
percent and mature...
asked 5 hours ago