 using the data table find the
following
using the data table find the
following ![[1pt] Volume to reach equivalence point: Click or tap here to enter text. [1pt] Half the volume to reach the equivalence poin](http://img.homeworklib.com/questions/4cbba7a0-85fc-11eb-bc58-1d5a77e7618b.png?x-oss-process=image/resize,w_560)
Homework Answers
Answer
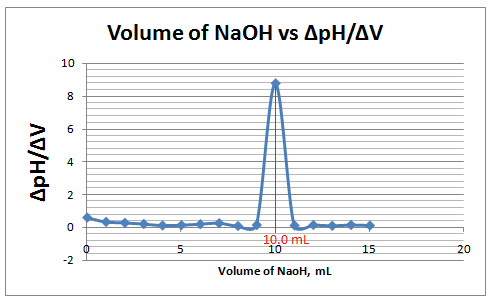
Equivalence point in the pH curve = 10.0 mL
Half the volume to reach the equivalence point = 5.0 mL
Explanation
[For the sake of accuracy in result, equivalence point obtained from derivative graph, not from primary graph]
| Volume of NaOH added, V, mL | pH |  pH pH |
V |
pH/V |
| 0.0 | 1.96 | 0.59 | 1 | 0.59 |
| 1.0 | 2.55 | 0.33 | 1 | 0.33 |
| 2.0 | 2.88 | 0.27 | 1 | 0.27 |
| 3.0 | 3.05 | 0.20 | 1 | 0.20 |
| 4.0 | 3.25 | 0.11 | 1 | 0.11 |
| 5.0 | 3.36 | 0.13 | 1 | 0.13 |
| 6.0 | 3.49 | 0.19 | 1 | 0.19 |
| 7.0 | 3.68 | 0.25 | 1 | 0.25 |
| 8.0 | 3.93 | 0.08 | 1 | 0.08 |
| 9.0 | 4.01 | 0.14 | 1 | 0.14 |
| 10.0 | 4.15 | 8.75 | 1 | 8.75 |
| 11.0 | 12.90 | 0.11 | 1 | 0.11 |
| 12.0 | 13.01 | 0.14 | 1 | 0.14 |
| 13.0 | 13.15 | 0.09 | 1 | 0.09 |
| 14.0 | 13.24 | 0.14 | 1 | 0.14 |
| 15.0 | 13.38 | 0.11 | 1 | 0.11 |
| 16.0 | 13.49 |
Primary graph

Derivative graph
The sudden increase in volume of NaOH against
pH/V,
gives the equivalence point of pH curve. Here it is 10.0
mL. Whereas, half the volume to reach equivalence point is
given by
Half the volume to reach eq. point = 
= 10.0/2
= 5.0 mL
Add Answer to:
using the data table find the
following
pH pH Volume of NaOH added, ml 0.00 mL...
Construct a rough plot of pH versus volume of added base for the titration of 50 mL of 0.045 M HCN with 0.075 M NaOH.
 Construct a rough plot of pH versus volume of added base for the titration of 50 mL of 0.045 M HCN with 0.075 M NaOH.(a) What is the pH before any NaOH is added? (b) What volume of base, in milliliters, is required to reach the equivalence point? (c) What is the pH at the equivalence point? (d) What indicator would be most suitable to determine the endpoint?bromocresol green Alizarin yellow GG Bromthymol blue bromcresol purple
PROCESSING THE DATA 1. COMPLETE DATA TABLE 2. Determine the volume of NaQH added at the...
 PROCESSING THE DATA 1. COMPLETE DATA TABLE 2. Determine the volume of NaQH added at the equivalence point. 3. Calculate the number of moles of NaOH used. 4. See the equation for the neutralization reaction given in the introduction. Determine the number of moles of HCl used. 5. Recall that you pipeted out 10.0 mL of the unknown HCl solution for the titration. Calculate the HCl concentration. Trail 1 Trial 2 Concentration of NaQH 0.1 M 0 ml NaQH volume...
Question 3: Draw the titration curve (pH versus mL of NaOH added) that would be obtained...
 Question 3: Draw the titration curve (pH versus mL of NaOH added) that would be obtained from the titration of 30 mL of a 0.10 M solution of an unknown triprotic acid, H3A (Kat = 1.26 x 10⁻³; Ka2 = 5.6 x 10⁻⁶, Ka3 = 3.32 x 10⁻¹⁰) with 0.10 M NaOH. Indicate the volume needed to reach the first second, and third equivalence points and the pH at the half equivalence points for the three titration regions.
NaOH solution Add Base 1.00 ml 0.10 mL Base Added 10.10 ml 0.05 mL Experimental Settings...
 NaOH solution Add Base 1.00 ml 0.10 mL Base Added 10.10 ml 0.05 mL Experimental Settings Indicator Methyl orange [NaOH] = 0.50 M • Phenolphthalein Thymolphthalein Set (NaOH), choose an indicator, and add base in increments using the buttons above Retitrate Unknown acid solution 25 ml 1 of 1 The flask contains 25 mL of an unknown diprotic acid aqueous solution that reacts in a 1:2 stochiometric ratio with NaOH. Titrate the solution with NaOH to determine the concentration of...
could you show calculations please . ncentration of NaOH used in the titration: 0.500 1 of...
 could you show calculations please .
ncentration of NaOH used in the titration: 0.500 1 of 1 ss of unknown acid you used in grams. (g) 0.75 PIVO Vuine Measurements Enter all of the following data as prompted by the data point number. You have UNKNOWN A. 4 5 8 Data Point # Volume (mL) pH Data Point # Volume (mL) pH 0.00 1.23 19 17.97 6.40 2 0.99 1.32 20 18.97 6.53 3 2.00 1.41 21 20.02 6.67 2.97...
could you show calculations please .
ncentration of NaOH used in the titration: 0.500 1 of 1 ss of unknown acid you used in grams. (g) 0.75 PIVO Vuine Measurements Enter all of the following data as prompted by the data point number. You have UNKNOWN A. 4 5 8 Data Point # Volume (mL) pH Data Point # Volume (mL) pH 0.00 1.23 19 17.97 6.40 2 0.99 1.32 20 18.97 6.53 3 2.00 1.41 21 20.02 6.67 2.97...
pH be at the equivalence point? Volume NaOH added pH 0.39 The student collected the following...
 pH be at the equivalence point? Volume NaOH added pH 0.39 The student collected the following data: Plot the data above in excel with pH values on the Y axis and the volume of NaOH added on the X axis Graphically determine the equivalence point and indicate the pH on the graph. b. 0.00 2.00 4.00 0.46 0.54 ii. 0.62 6.00 8.00 10.00 0.7 0.78 Show the following calculations on a separate sheet of paper: 0.87 12.00 0.96 1.07 14.00...
Enter the following data into the calculator and graph pH versus mL of NaOH added. At...
Enter the following data into the calculator and graph pH versus mL of NaOH added. At the endpoint you should see a rapid change in pH. Identify the two volumes on each side of the endpoint, and determine the color change of the indicator for the end point. Data Analysis Table Volume of NaOH Solution Added pH Color 0.00 mL 2.79 Clear 1.00 mL 3.99 Magenta then clear 2.00 mL 4.49 Magenta then clear 3.00 mL 4.99 Magenta then clear...
IF YOUR LAST NAME STARTS WITH A LETTER BETWEEN J-R, USE THIS SAMPLE DATA Sample Data...
 IF YOUR LAST NAME STARTS WITH A LETTER BETWEEN J-R, USE THIS SAMPLE DATA Sample Data - Diprotic Acid Titration Initial Data Enter the concentration of NaOH used in the titration: 0.500 Enter the mass of unknown acid you used in grams. (g) 0.75 pH vs Volume Measurements Enter all of the following data as prompted by the data point number. You have UNKNOWN B. Data Point # Volume (mL) pH Data Point # pH Volume (mL) 17.97 1 0.00...
Table 1. pH readings 12.00 (34.02. 12.58) 11.00 10.00 . 9.00 8.00 7.00 6.00 5.00 р...
 Table 1. pH readings 12.00 (34.02. 12.58) 11.00 10.00 . 9.00 8.00 7.00 6.00 5.00 р 4.00 3.00 2.00 1.00 0.00 0.00 2.00 4.00 6.00 8.00 10.00 12.00 14.00 16.00 18.00 20.00 22.00 24.00 26,00 28.00 30.00 32.00 34.00 Volume (ml) Initial Data Enter the concentration of NaOH used in the titration: 0.500 Enter the mass of unknown acid you used in grams. (g) 0.75 pH vs Volume Measurements Enter all of the following data as prompted by the data...
Construct a rough plot of pH versus volume of added base for the titration of 50...
 Construct a rough plot of pH versus volume of added base for the
titration of 50 mL of 0.070 M HCN with 0.075 M NaOH. Ka = 4.0*10-10
for HCN
(a) What is the pH before any NaOH is added?
(b) What volume of base, in milliliters, is required to reach the
equivalence point?
(c) What is the pH at the equivalence point?
(d) What indicator would be most suitable to determine the
endpoint?
(1).bromcresol purple
(2).bromocresol green
(3).Bromthymol blue...
Construct a rough plot of pH versus volume of added base for the
titration of 50 mL of 0.070 M HCN with 0.075 M NaOH. Ka = 4.0*10-10
for HCN
(a) What is the pH before any NaOH is added?
(b) What volume of base, in milliliters, is required to reach the
equivalence point?
(c) What is the pH at the equivalence point?
(d) What indicator would be most suitable to determine the
endpoint?
(1).bromcresol purple
(2).bromocresol green
(3).Bromthymol blue...
 Construct a rough plot of pH versus volume of added base for the titration of 50 mL of 0.045 M HCN with 0.075 M NaOH.(a) What is the pH before any NaOH is added? (b) What volume of base, in milliliters, is required to reach the equivalence point? (c) What is the pH at the equivalence point? (d) What indicator would be most suitable to determine the endpoint?bromocresol green Alizarin yellow GG Bromthymol blue bromcresol purple
 PROCESSING THE DATA 1. COMPLETE DATA TABLE 2. Determine the volume of NaQH added at the equivalence point. 3. Calculate the number of moles of NaOH used. 4. See the equation for the neutralization reaction given in the introduction. Determine the number of moles of HCl used. 5. Recall that you pipeted out 10.0 mL of the unknown HCl solution for the titration. Calculate the HCl concentration. Trail 1 Trial 2 Concentration of NaQH 0.1 M 0 ml NaQH volume...
 Question 3: Draw the titration curve (pH versus mL of NaOH added) that would be obtained from the titration of 30 mL of a 0.10 M solution of an unknown triprotic acid, H3A (Kat = 1.26 x 10⁻³; Ka2 = 5.6 x 10⁻⁶, Ka3 = 3.32 x 10⁻¹⁰) with 0.10 M NaOH. Indicate the volume needed to reach the first second, and third equivalence points and the pH at the half equivalence points for the three titration regions.
 NaOH solution Add Base 1.00 ml 0.10 mL Base Added 10.10 ml 0.05 mL Experimental Settings Indicator Methyl orange [NaOH] = 0.50 M • Phenolphthalein Thymolphthalein Set (NaOH), choose an indicator, and add base in increments using the buttons above Retitrate Unknown acid solution 25 ml 1 of 1 The flask contains 25 mL of an unknown diprotic acid aqueous solution that reacts in a 1:2 stochiometric ratio with NaOH. Titrate the solution with NaOH to determine the concentration of...
 could you show calculations please .
ncentration of NaOH used in the titration: 0.500 1 of 1 ss of unknown acid you used in grams. (g) 0.75 PIVO Vuine Measurements Enter all of the following data as prompted by the data point number. You have UNKNOWN A. 4 5 8 Data Point # Volume (mL) pH Data Point # Volume (mL) pH 0.00 1.23 19 17.97 6.40 2 0.99 1.32 20 18.97 6.53 3 2.00 1.41 21 20.02 6.67 2.97...
could you show calculations please .
ncentration of NaOH used in the titration: 0.500 1 of 1 ss of unknown acid you used in grams. (g) 0.75 PIVO Vuine Measurements Enter all of the following data as prompted by the data point number. You have UNKNOWN A. 4 5 8 Data Point # Volume (mL) pH Data Point # Volume (mL) pH 0.00 1.23 19 17.97 6.40 2 0.99 1.32 20 18.97 6.53 3 2.00 1.41 21 20.02 6.67 2.97...
 pH be at the equivalence point? Volume NaOH added pH 0.39 The student collected the following data: Plot the data above in excel with pH values on the Y axis and the volume of NaOH added on the X axis Graphically determine the equivalence point and indicate the pH on the graph. b. 0.00 2.00 4.00 0.46 0.54 ii. 0.62 6.00 8.00 10.00 0.7 0.78 Show the following calculations on a separate sheet of paper: 0.87 12.00 0.96 1.07 14.00...
 IF YOUR LAST NAME STARTS WITH A LETTER BETWEEN J-R, USE THIS SAMPLE DATA Sample Data - Diprotic Acid Titration Initial Data Enter the concentration of NaOH used in the titration: 0.500 Enter the mass of unknown acid you used in grams. (g) 0.75 pH vs Volume Measurements Enter all of the following data as prompted by the data point number. You have UNKNOWN B. Data Point # Volume (mL) pH Data Point # pH Volume (mL) 17.97 1 0.00...
 Table 1. pH readings 12.00 (34.02. 12.58) 11.00 10.00 . 9.00 8.00 7.00 6.00 5.00 р 4.00 3.00 2.00 1.00 0.00 0.00 2.00 4.00 6.00 8.00 10.00 12.00 14.00 16.00 18.00 20.00 22.00 24.00 26,00 28.00 30.00 32.00 34.00 Volume (ml) Initial Data Enter the concentration of NaOH used in the titration: 0.500 Enter the mass of unknown acid you used in grams. (g) 0.75 pH vs Volume Measurements Enter all of the following data as prompted by the data...
 Construct a rough plot of pH versus volume of added base for the
titration of 50 mL of 0.070 M HCN with 0.075 M NaOH. Ka = 4.0*10-10
for HCN
(a) What is the pH before any NaOH is added?
(b) What volume of base, in milliliters, is required to reach the
equivalence point?
(c) What is the pH at the equivalence point?
(d) What indicator would be most suitable to determine the
endpoint?
(1).bromcresol purple
(2).bromocresol green
(3).Bromthymol blue...
Construct a rough plot of pH versus volume of added base for the
titration of 50 mL of 0.070 M HCN with 0.075 M NaOH. Ka = 4.0*10-10
for HCN
(a) What is the pH before any NaOH is added?
(b) What volume of base, in milliliters, is required to reach the
equivalence point?
(c) What is the pH at the equivalence point?
(d) What indicator would be most suitable to determine the
endpoint?
(1).bromcresol purple
(2).bromocresol green
(3).Bromthymol blue...
Most questions answered within 3 hours.
-
QUESTION 17
The wavelength of blue light is comparable to the size of
A.
At atomic...
asked 31 seconds from now -
Ball 1, with a mass of 120 g and traveling at 11 m/s , collides
head...
asked 3 minutes ago -
This question is about calculating and printing
payslips. User inputs his name, number of worked hours...
asked 4 minutes ago -
What is an interaction style and what is its role in effective
interface design? List and...
asked 12 minutes ago -
EXPLAIN HOW THIS PROGRAM WORKS, USING DEV C++
#include <iostream>
#include <cmath>
#define PI 3.1415926535897
using...
asked 24 minutes ago -
In the method below, add code to return the index of the element
in array that...
asked 37 minutes ago -
If Inventory is sold FOB destination, the title transfers from
seller to buyer:
A.when the goods...
asked 35 minutes ago -
Imagine that you’ve been asked to explain one of the major
accounting ratios to a group...
asked 37 minutes ago -
The vapor pressure of liquid propyl amine, C3H7NH2, is 100. mm
Hg at 274 K. A...
asked 1 hour ago -
1) Calculate the momentum of the Titanic (m = 4.2 * 10^7 kg)
moving at 14...
asked 1 hour ago -
As a human service worker under what circumstances can
information be disclosed without a client’s consent
asked 1 hour ago -
A gas is compressed from an initial volume of 5.40 L to a
final volume of...
asked 1 hour ago