


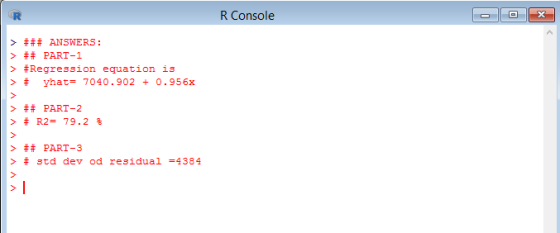
Homework Answers
![R Console > > ## ## x=1988 GDP/capita y-1998-2000 GDP/capita [1] 24241 17339 25682 19349 25626 36301 17676 13050 43375 27196](http://img.homeworklib.com/questions/a32ea0a0-8c52-11eb-be7d-fbc68f38f519.png?x-oss-process=image/resize,w_560)
Add Answer to:
The GDP per capita in 1988 and 1998-2000 for 12 countries (both in year 2000 dollars)...
In 1900 GDP per capita in Japan (measured in year 2005 dollars) was $1,617. In 2000...
 In 1900 GDP per capita in Japan (measured in year 2005 dollars) was $1,617. In 2000 it was $29,639. Calculate the growth rate of income per capita in Japan over this period. Now sup- pose that Japan grows at the same rate for the century following 2000. What will Japanese GDP per capita be in the year 2100? 5.
The table below reports per capita GDP and capital per person in the year 2014 for...
 The table below reports per capita GDP and capital per person in
the year 2014 for 10
countries. Your task is to fill in the missing columns of the
table.
a)Given the values in column 1 and 2, fill in columns 3 and 4.
That is, compute per capita GDP and capital per person relative to
the U.S. values.
b)In column 5, use the production model (with a capital exponent
of 1/3) to compute
predicted per capita GDP for each...
The table below reports per capita GDP and capital per person in
the year 2014 for 10
countries. Your task is to fill in the missing columns of the
table.
a)Given the values in column 1 and 2, fill in columns 3 and 4.
That is, compute per capita GDP and capital per person relative to
the U.S. values.
b)In column 5, use the production model (with a capital exponent
of 1/3) to compute
predicted per capita GDP for each...
The information below describes the real GDP per capita for a country for the period from...
 The information below describes the real GDP per capita for a
country for the period from 1985 through to 2001.
If a new business cycle began in 1985, how long was this
cycle?
In which year did the peak occur? The trough occurred in which
year?
How long was the expansion? How long was the recession?
Year 1985 1986 1987 1988 1989 1990 1991 1992 1993 1994 1995 1996 1997 1998 1999 2000 2001 Real GDP per Capita 6,000 6,300...
The information below describes the real GDP per capita for a
country for the period from 1985 through to 2001.
If a new business cycle began in 1985, how long was this
cycle?
In which year did the peak occur? The trough occurred in which
year?
How long was the expansion? How long was the recession?
Year 1985 1986 1987 1988 1989 1990 1991 1992 1993 1994 1995 1996 1997 1998 1999 2000 2001 Real GDP per Capita 6,000 6,300...
The real GDP per capita in US is higher than almost all other countries in the...
The real GDP per capita in US is higher than almost all other countries in the world. What do you think may be some major reasons for the US GDP per capita to be higher?
There are two countries in the world: Wallyworld and Vanhausland. Both countries currently have a GDP...
 There are two countries in the world: Wallyworld and Vanhausland. Both countries currently have a GDP per capita of 1. Use the information in the table about growth and productivity to answer the questions. Round all numerical answers to two decimal places. Country Wallyworld Vanhausland Growth rate of GDP per capita 0.096 0.016 What is GDP per capita in Wallyworld in 23 years ? Wallyworld's GDP: $ What is GDP per capita in Vanhausland in 23 years? Vanhausland's GDP: $...
Reference equation: Real GDP per capita growth rate = Nominal GDP per capita growth rate -...
Reference equation: Real GDP per capita growth rate = Nominal GDP per capita growth rate - Inflation rate - Population growth rateThis equation is an approximation of the exact rate of growth of GDP per capita, and so it results in some errors when calculating this rate. However, the simplified equation both is easy to use and results in small error terms when inflation, nominal GDP growth, and population growth are low, and so it is a useful approximation. The...
Reference equation: Real GDP per capita growth rate Nominal GDP per capita growth rate - Inflation...
 Reference equation: Real GDP per capita growth rate Nominal GDP per capita growth rate - Inflation rate - Population growth rate This equation is an approximation of the exact rate of growth of GDP per capita, and so it results in some errors when calculating this rate. However, the simplified equation both is easy to use and results in small error terms when inflation, nominal GDP growth, and population growth are low, and so it is a useful approximation. The...
Growth Rate South Korea Real GDP per capita Growth Rate Year 1970 1980 Growth Rate Canada...
 Growth Rate South Korea Real GDP per capita Growth Rate Year 1970 1980 Growth Rate Canada Real GDP per capita $12,717 $16,731 Uganda Real GDP per capita $190 $1,886 $3,262 $182 $176 1990 $19,540 $23,156 $6,615 $10,80% 2000 Source: Organisation for Economic Cooperation and Development (OECD) The (decade-long) economic growth rate for Canada is shown in the second column. For example, from 1970 to 1980, Canada GDP grew from $12,717 to $16,731, an increase of Sie 512717 1711-512.717 32 Use...
The following table lists gross domestic product (GDP) and approximate population for four countries in 2013....
 The following table lists gross domestic product (GDP) and approximate population for four countries in 2013. Note that GDP is given in millions of U.S dollars (USD). For example, a value of 16,800,000 suggests that U.S. GDP was approximately $16.8 trillion in 2013. GDP per capita, however, is simply given in dollars (USD) Calculate GDP per capita for each country and enter it in the fourth column of the table GDP per capita (USD) GDP France Liberia India United States...
Trade Balance (% GDP) / GDP ($ per capita) -1.4 20062 13.2 36807 0.2 27363 -6...
 Trade Balance (% GDP) / GDP ($ per capita)
-1.4 20062
13.2 36807
0.2 27363
-6 33552
6.4 26059
9.4 37202
2.2 16518
15.9 56163
-0.3 15832
0.3 38259
13.2 36372
6.9 43251
1.2 8772
-7 18603
-2.2 39321
1.4 42305
-6.3 27453
10.4 59576
-2.5 23101
-5.9 3788
An economic organization tracks summary statistics of various countries. These include GDP (gross domestic product per capita) and trade balances (measured as a percentage of GDP). Exporting countries tend to have...
Trade Balance (% GDP) / GDP ($ per capita)
-1.4 20062
13.2 36807
0.2 27363
-6 33552
6.4 26059
9.4 37202
2.2 16518
15.9 56163
-0.3 15832
0.3 38259
13.2 36372
6.9 43251
1.2 8772
-7 18603
-2.2 39321
1.4 42305
-6.3 27453
10.4 59576
-2.5 23101
-5.9 3788
An economic organization tracks summary statistics of various countries. These include GDP (gross domestic product per capita) and trade balances (measured as a percentage of GDP). Exporting countries tend to have...
 In 1900 GDP per capita in Japan (measured in year 2005 dollars) was $1,617. In 2000 it was $29,639. Calculate the growth rate of income per capita in Japan over this period. Now sup- pose that Japan grows at the same rate for the century following 2000. What will Japanese GDP per capita be in the year 2100? 5.
 The table below reports per capita GDP and capital per person in
the year 2014 for 10
countries. Your task is to fill in the missing columns of the
table.
a)Given the values in column 1 and 2, fill in columns 3 and 4.
That is, compute per capita GDP and capital per person relative to
the U.S. values.
b)In column 5, use the production model (with a capital exponent
of 1/3) to compute
predicted per capita GDP for each...
The table below reports per capita GDP and capital per person in
the year 2014 for 10
countries. Your task is to fill in the missing columns of the
table.
a)Given the values in column 1 and 2, fill in columns 3 and 4.
That is, compute per capita GDP and capital per person relative to
the U.S. values.
b)In column 5, use the production model (with a capital exponent
of 1/3) to compute
predicted per capita GDP for each...
 The information below describes the real GDP per capita for a
country for the period from 1985 through to 2001.
If a new business cycle began in 1985, how long was this
cycle?
In which year did the peak occur? The trough occurred in which
year?
How long was the expansion? How long was the recession?
Year 1985 1986 1987 1988 1989 1990 1991 1992 1993 1994 1995 1996 1997 1998 1999 2000 2001 Real GDP per Capita 6,000 6,300...
The information below describes the real GDP per capita for a
country for the period from 1985 through to 2001.
If a new business cycle began in 1985, how long was this
cycle?
In which year did the peak occur? The trough occurred in which
year?
How long was the expansion? How long was the recession?
Year 1985 1986 1987 1988 1989 1990 1991 1992 1993 1994 1995 1996 1997 1998 1999 2000 2001 Real GDP per Capita 6,000 6,300...
 There are two countries in the world: Wallyworld and Vanhausland. Both countries currently have a GDP per capita of 1. Use the information in the table about growth and productivity to answer the questions. Round all numerical answers to two decimal places. Country Wallyworld Vanhausland Growth rate of GDP per capita 0.096 0.016 What is GDP per capita in Wallyworld in 23 years ? Wallyworld's GDP: $ What is GDP per capita in Vanhausland in 23 years? Vanhausland's GDP: $...
 Reference equation: Real GDP per capita growth rate Nominal GDP per capita growth rate - Inflation rate - Population growth rate This equation is an approximation of the exact rate of growth of GDP per capita, and so it results in some errors when calculating this rate. However, the simplified equation both is easy to use and results in small error terms when inflation, nominal GDP growth, and population growth are low, and so it is a useful approximation. The...
 Growth Rate South Korea Real GDP per capita Growth Rate Year 1970 1980 Growth Rate Canada Real GDP per capita $12,717 $16,731 Uganda Real GDP per capita $190 $1,886 $3,262 $182 $176 1990 $19,540 $23,156 $6,615 $10,80% 2000 Source: Organisation for Economic Cooperation and Development (OECD) The (decade-long) economic growth rate for Canada is shown in the second column. For example, from 1970 to 1980, Canada GDP grew from $12,717 to $16,731, an increase of Sie 512717 1711-512.717 32 Use...
 The following table lists gross domestic product (GDP) and approximate population for four countries in 2013. Note that GDP is given in millions of U.S dollars (USD). For example, a value of 16,800,000 suggests that U.S. GDP was approximately $16.8 trillion in 2013. GDP per capita, however, is simply given in dollars (USD) Calculate GDP per capita for each country and enter it in the fourth column of the table GDP per capita (USD) GDP France Liberia India United States...
 Trade Balance (% GDP) / GDP ($ per capita)
-1.4 20062
13.2 36807
0.2 27363
-6 33552
6.4 26059
9.4 37202
2.2 16518
15.9 56163
-0.3 15832
0.3 38259
13.2 36372
6.9 43251
1.2 8772
-7 18603
-2.2 39321
1.4 42305
-6.3 27453
10.4 59576
-2.5 23101
-5.9 3788
An economic organization tracks summary statistics of various countries. These include GDP (gross domestic product per capita) and trade balances (measured as a percentage of GDP). Exporting countries tend to have...
Trade Balance (% GDP) / GDP ($ per capita)
-1.4 20062
13.2 36807
0.2 27363
-6 33552
6.4 26059
9.4 37202
2.2 16518
15.9 56163
-0.3 15832
0.3 38259
13.2 36372
6.9 43251
1.2 8772
-7 18603
-2.2 39321
1.4 42305
-6.3 27453
10.4 59576
-2.5 23101
-5.9 3788
An economic organization tracks summary statistics of various countries. These include GDP (gross domestic product per capita) and trade balances (measured as a percentage of GDP). Exporting countries tend to have...
Most questions answered within 3 hours.
-
Jamie is doing a survey at her school about whether the students
feel the cafeteria food...
asked 47 minutes ago -
How many liters of 0.669 M KOH will be needed to raise the pH of
0.339...
asked 3 hours ago -
A liquid of density 1270 kg/m 3 flows steadily through a pipe of
varying diameter and...
asked 3 hours ago -
Questions: What should the American executive do?
'A visiting American executive finds that a foreign subsidiary...
asked 3 hours ago -
Activity based costing was introduced as an alternative to
absorption costing.
1. Discuss using illustration the...
asked 3 hours ago -
1. You own shares of Crane DVD Company and are interested in
selling them. With so...
asked 3 hours ago -
How many grams of He are necessary to fill a balloon having a
volume of 4.5E3...
asked 3 hours ago -
The 2 patients, still in the hospital, were interviewed by a
MoH epidemiologist. The interviews revealed...
asked 3 hours ago -
An uncharged capacitor and a resistor are connected in series to
a source of emf. If...
asked 3 hours ago -
If assets are $540,000 and liabilities are $236,000 what is the
amount of owner’s equity?
asked 3 hours ago -
MATH 3421 Maple Assignment 1 Due February 13, 2019 Maple is a
Computer Algebra System that...
asked 3 hours ago -
CODING IN JAVA
Dates are printed in several common formats. Two of the more
common formats...
asked 3 hours ago