Design a spreadsheet that can be used to evaluate aggregate plans. The spreadsheet should enable the evaluation of:
1.pure strategy based on leveling production,
2.pure strategy based on minimizing inventory by laying off/hiring as needed,
3.a mix of the above two.
The spreadsheet should have the following headings:
|
1 |
2 |
3 |
4 |
5 |
6 |
7 |
8 |
9 |
10 |
11 |
|
Sales in |
Production |
|||||||||
|
Month |
Sales |
labor-hour |
Working |
labor-hour |
Number of |
Workers |
Workers |
Beginning |
Ending |
Backorder |
|
(Million) |
(000s) |
days |
(000s) |
Workers |
Hired |
Fired |
Inventory |
Inventory |
All but columns 1, 2, and 4 should be computed using cell formulas. Column 5 should allow for using cell formulas in the case of level production or direct input for mixed plans. The cost of any plan, in total and for each cost component, should be computed without additional effort. Assume an 8-month horizon and use the following data to test your spreadsheet:
|
Sales per direct labor hour |
$30 |
|
Hiring cost |
$ 300.0 |
|
Firing cost |
$ 500.0 |
|
Regular labor cost per hour |
$ 15.00 |
|
Overtime premium cost per hour |
$ 7.50 |
|
Backorder cost per month |
2% |
|
Inventory carrying cost per month |
1% |
|
Beginning inventory |
$ 400000 |
|
Desired ending inventory in September |
$ 200000 |
|
Number of Employees as of end of December |
1900 |
|
Month |
Sales |
Working |
|
(Million) |
days |
|
|
January |
8.0 |
20 |
|
February |
7.4 |
21 |
|
March |
11.2 |
23 |
|
April |
11.0 |
20 |
|
May |
9.8 |
22 |
|
June |
8.0 |
22 |
|
July |
8.0 |
10 |
|
August |
10.6 |
23 |
|
September |
9.4 |
20 |
I have solved some of it but I got Stuck in Ending Inventory.
Thank you for your help. 
Homework Answers
The ending inventory is returned by the Excel Solver using the following spreadsheet models.
1. Pure strategy based on level production
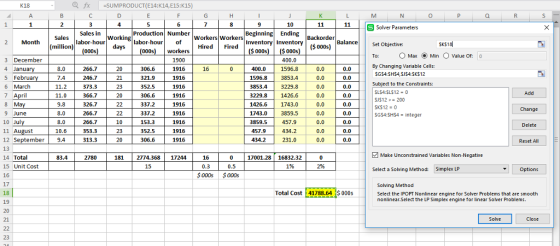
Formulas:

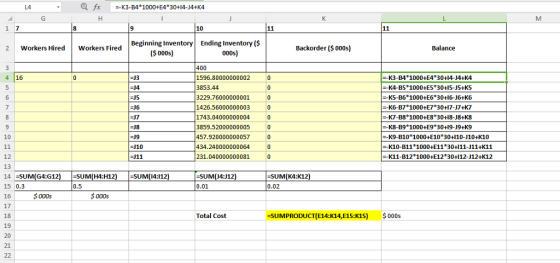
2. Pure strategy based on minimizing inventory by laying off/hiring as needed
In this model, we have changed the objective from minimizing total cost to minimizing total ending inventory. Resulting solution is following:

3. Mix strategy

Add Answer to:
Design a spreadsheet that can be used to evaluate aggregate
plans. The spreadsheet should enable the...
Plan production for a four-month period: February through May. For February and March, you should produce...
Plan production for a four-month period: February through May. For February and March, you should produce to exact demand forecast. For April and May, you should use overtime and inventory with a stable workforce; stable means that the number of workers needed for March will be held constant through May. However, government constraints put a maximum of 5,000 hours of overtime labor per month in April and May (zero overtime in February and March). If demand exceeds supply, then backorders...
Q1. Prestige, Inc. needs an aggregate plan for its product line. As part of trying to...
 Q1. Prestige, Inc. needs an aggregate plan for its product line. As part of trying to maintain a lean production system, management prefers a constant workforce, no overtime, and constant production level. Relevant data follows: Item Data | Units Data Item | Data | Units Production time required labor hours per unit 4.5 Units % of monthly forecast 0% Hiring cost $10,000 Item Ending inventory target Shortage cost per person Straight time labor cost per hour $75 per unit Laying...
USE LEVEL AGGREGATE PLAN: Cost data Regular time labor cost per hour $10 Overtime time labor...
USE LEVEL AGGREGATE PLAN: Cost data Regular time labor cost per hour $10 Overtime time labor cost per hour $15 Subcontracting cost per unit $80 Back order cost per unit per period $20 Inventory holding cost per unit per period $10 Hiring cost per employee $400 Firing cost per employee $500 Capacity data Beginning workforce 40 employees Beginning inventory 0 units Beginning backorders 0 units Production standard per unit (hours) 2 hours of labor per unit Regular time available per...
Q. Find optimal solution Demand & # of working days Jan Feb Mar Ap May Jun Total Forecast 2.760 3...
 How can i solve optimalsolution??
Q. Find optimal solution Demand & # of working days Jan Feb Mar Ap May Jun Total Forecast 2.760 3.320 3,970 3,540 3,180 2,900 19,670 # of working days: 21 20 23 21 4 units/worker/day inventory holding cost is $2 per gear per month. oHiring cost: $200 per worker Layoff cost: $500 per worker Wages and benefits: $15/worker/hour 8 hours/ day, 35 workers Beginning workforce level1437 Beginning inventory level -215000 Ending inventory level 5 days...
How can i solve optimalsolution??
Q. Find optimal solution Demand & # of working days Jan Feb Mar Ap May Jun Total Forecast 2.760 3.320 3,970 3,540 3,180 2,900 19,670 # of working days: 21 20 23 21 4 units/worker/day inventory holding cost is $2 per gear per month. oHiring cost: $200 per worker Layoff cost: $500 per worker Wages and benefits: $15/worker/hour 8 hours/ day, 35 workers Beginning workforce level1437 Beginning inventory level -215000 Ending inventory level 5 days...
Plan production for a four-month period: February through May. For February and March, you should produce...
 Plan production for a four-month period: February through May. For February and March, you should produce to exact demand forecast. For April and May, you should use overtime and inventory with a stable workforce; stable means that the number of workers needed for March will be held constant through May. However, government constraints put a maximum of 5,000 hours of overtime labor per month in April and May (zero overtime in February and March). If demand exceeds supply, then backorders...
The owner of a small mill-working plant that builds cabinets is developing his aggregate plan for...
 The owner of a small mill-working plant that builds cabinets is
developing his aggregate plan for the next year. The relevant cost
data and forecast for the next 4 quarters is provided below. The
company currently has 20 employees and works one 8 hour shift each
day with 2 paid 15 minute breaks. Assume each quarter has 65
working days, and that it currently has no units in stock. Use this
information and the information from the table to answer...
The owner of a small mill-working plant that builds cabinets is
developing his aggregate plan for the next year. The relevant cost
data and forecast for the next 4 quarters is provided below. The
company currently has 20 employees and works one 8 hour shift each
day with 2 paid 15 minute breaks. Assume each quarter has 65
working days, and that it currently has no units in stock. Use this
information and the information from the table to answer...
Problem 8-8 Plan production for a four-month period: February through May. For February and March, you...
 Problem 8-8 Plan production for a four-month period: February through May. For February and March, you should produce to exact demand forecast. For April and May, you should use overtime and inventory with a stable workforce; stable means that the number of workers needed for March will be held constant through May. However, government constraints put a maximum of 5,000 hours of overtime labor per month in April and May (zero overtime in February and March). If demand exceeds supply,...
Please help with the missing numbers above Also Total hiring cost $ _?(enter response as whole...
 Please help with the missing
numbers above
Also
Total hiring cost $ _?(enter response as whole number)
Total layoff cost $ _?(enter response as whole number)
Total inventory carrying cost $ _?(enter response as whole
number)
Total stockout cost $ _?(enter response as whole number)
Total cost, excluding normal time labor costs, for Plan B $
_?(enter response as whole number)
The S&OP team at Kansas Furniture, has received estimates of demand requirements as shown in the table. Assuming one-time...
Please help with the missing
numbers above
Also
Total hiring cost $ _?(enter response as whole number)
Total layoff cost $ _?(enter response as whole number)
Total inventory carrying cost $ _?(enter response as whole
number)
Total stockout cost $ _?(enter response as whole number)
Total cost, excluding normal time labor costs, for Plan B $
_?(enter response as whole number)
The S&OP team at Kansas Furniture, has received estimates of demand requirements as shown in the table. Assuming one-time...
02 Consuelo Chua, Inc., is a disk drive manufacturer in need of an aggregate plan for...
 02 Consuelo Chua, Inc., is a disk drive manufacturer in need of an aggregate plan for July through December. The com- pany has gathered the following data: COSTS Holding cost $8/disk/month Subcontracting 580/disk Regular-time labor $12 hour Overtime labor $18 hour for hours above 8 hours/workerday Hiring cost $4000/ worker Layoff cost $8000/worker DEMAND Note: In this problem (and Q3) the production cost should be computed based on the labor cost OTHER DATA Current worden 8 people Labor hours disk...
The following is simplified aggregate planning information (no hiring or layoff is expected): July August September...
The following is simplified aggregate planning information (no hiring or layoff is expected): July August September Beginning inventory, units 105 Demand forecast, units 610 530 720 Safety stock, units Production requirements, units Workers required 20 20 20 New workers hired 0 0 0 Workers laid off 0 0 0 Actual production, units 650 650 650 Ending inventory, units Consider that these months have the same number of workdays. There will be no new hiring or layoffs during the 3-month period....
 Q1. Prestige, Inc. needs an aggregate plan for its product line. As part of trying to maintain a lean production system, management prefers a constant workforce, no overtime, and constant production level. Relevant data follows: Item Data | Units Data Item | Data | Units Production time required labor hours per unit 4.5 Units % of monthly forecast 0% Hiring cost $10,000 Item Ending inventory target Shortage cost per person Straight time labor cost per hour $75 per unit Laying...
 How can i solve optimalsolution??
Q. Find optimal solution Demand & # of working days Jan Feb Mar Ap May Jun Total Forecast 2.760 3.320 3,970 3,540 3,180 2,900 19,670 # of working days: 21 20 23 21 4 units/worker/day inventory holding cost is $2 per gear per month. oHiring cost: $200 per worker Layoff cost: $500 per worker Wages and benefits: $15/worker/hour 8 hours/ day, 35 workers Beginning workforce level1437 Beginning inventory level -215000 Ending inventory level 5 days...
How can i solve optimalsolution??
Q. Find optimal solution Demand & # of working days Jan Feb Mar Ap May Jun Total Forecast 2.760 3.320 3,970 3,540 3,180 2,900 19,670 # of working days: 21 20 23 21 4 units/worker/day inventory holding cost is $2 per gear per month. oHiring cost: $200 per worker Layoff cost: $500 per worker Wages and benefits: $15/worker/hour 8 hours/ day, 35 workers Beginning workforce level1437 Beginning inventory level -215000 Ending inventory level 5 days...
 Plan production for a four-month period: February through May. For February and March, you should produce to exact demand forecast. For April and May, you should use overtime and inventory with a stable workforce; stable means that the number of workers needed for March will be held constant through May. However, government constraints put a maximum of 5,000 hours of overtime labor per month in April and May (zero overtime in February and March). If demand exceeds supply, then backorders...
 The owner of a small mill-working plant that builds cabinets is
developing his aggregate plan for the next year. The relevant cost
data and forecast for the next 4 quarters is provided below. The
company currently has 20 employees and works one 8 hour shift each
day with 2 paid 15 minute breaks. Assume each quarter has 65
working days, and that it currently has no units in stock. Use this
information and the information from the table to answer...
The owner of a small mill-working plant that builds cabinets is
developing his aggregate plan for the next year. The relevant cost
data and forecast for the next 4 quarters is provided below. The
company currently has 20 employees and works one 8 hour shift each
day with 2 paid 15 minute breaks. Assume each quarter has 65
working days, and that it currently has no units in stock. Use this
information and the information from the table to answer...
 Problem 8-8 Plan production for a four-month period: February through May. For February and March, you should produce to exact demand forecast. For April and May, you should use overtime and inventory with a stable workforce; stable means that the number of workers needed for March will be held constant through May. However, government constraints put a maximum of 5,000 hours of overtime labor per month in April and May (zero overtime in February and March). If demand exceeds supply,...
 Please help with the missing
numbers above
Also
Total hiring cost $ _?(enter response as whole number)
Total layoff cost $ _?(enter response as whole number)
Total inventory carrying cost $ _?(enter response as whole
number)
Total stockout cost $ _?(enter response as whole number)
Total cost, excluding normal time labor costs, for Plan B $
_?(enter response as whole number)
The S&OP team at Kansas Furniture, has received estimates of demand requirements as shown in the table. Assuming one-time...
Please help with the missing
numbers above
Also
Total hiring cost $ _?(enter response as whole number)
Total layoff cost $ _?(enter response as whole number)
Total inventory carrying cost $ _?(enter response as whole
number)
Total stockout cost $ _?(enter response as whole number)
Total cost, excluding normal time labor costs, for Plan B $
_?(enter response as whole number)
The S&OP team at Kansas Furniture, has received estimates of demand requirements as shown in the table. Assuming one-time...
 02 Consuelo Chua, Inc., is a disk drive manufacturer in need of an aggregate plan for July through December. The com- pany has gathered the following data: COSTS Holding cost $8/disk/month Subcontracting 580/disk Regular-time labor $12 hour Overtime labor $18 hour for hours above 8 hours/workerday Hiring cost $4000/ worker Layoff cost $8000/worker DEMAND Note: In this problem (and Q3) the production cost should be computed based on the labor cost OTHER DATA Current worden 8 people Labor hours disk...
Most questions answered within 3 hours.
-
Consider a 1.0 L buffer containing 0.092 mol L-1 HCOOH and 0.100
mol L-1 HCOO-. What...
asked 5 minutes ago -
Koch Realty has owned a vacant land with a FMV of
$775,000 and an adjusted basis...
asked 11 minutes ago -
It is estimated 29% of all adults in United States invest in
stocks and that 85%...
asked 11 minutes ago -
What does a 2-sided p value of 0.04 mean? (I am not asking if it
is...
asked 25 minutes ago -
A parallel-plate capacitor is made from two aluminum-foil
sheets, each 7.8 cmcm wide and 5.1 mmlong....
asked 26 minutes ago -
1. why is toluene a stronger nucleophile than benzene?
2.why is phenol a stronger nucleophile than...
asked 43 minutes ago -
4. How can you solve for the density of the liquid from the
slope? Please show...
asked 43 minutes ago -
when 2053 j of heat is added to 46.3 g of hexane C6H14 the
temperature increases...
asked 1 hour ago -
I need new and unique answers, please. (Use your own words,
don't copy and paste), Please...
asked 1 hour ago -
MCL 445.111 et seq. deals with Home Solicitation Sales.
MCL stands for Michigan Compiled Laws which...
asked 1 hour ago -
Which of the following items may not create an NOL?
a.
sole proprietorship loss
b.
personal...
asked 1 hour ago -
A hypothetical solution forms between a solid and a liquid. The
values of the thermodynamic quantities...
asked 1 hour ago