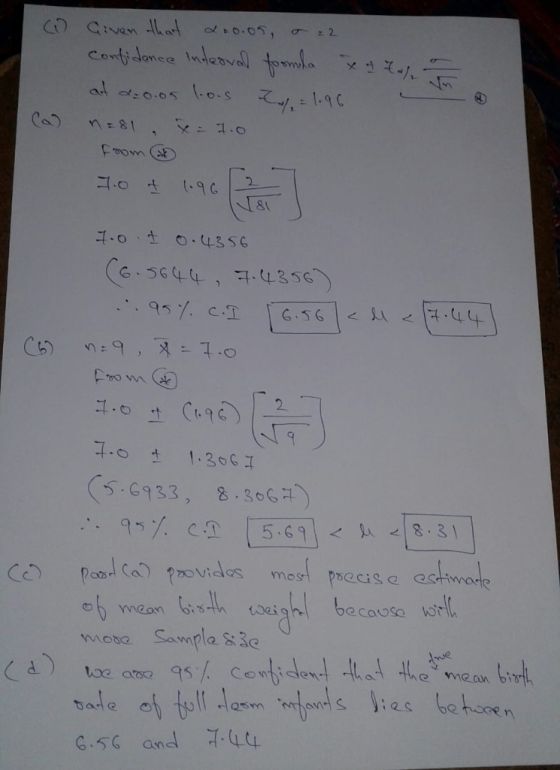
1. Newborn weight. A study takes a SRS from a population of full-term infants. The standard deviation of birth weights in this population is 2 pounds. Calculate 95% confidence intervals for μ for samples in which:
a) n = 81 and = 7.0 pounds
b) n = 9 and = 7.0 pounds
c) Which sample provides the most precise estimate of the mean birth weight?
d) Interpret the CI you computed in part a).
2. P-value and confidence interval. A two-sided test of H0: μ = 0 yields a P-value of 0.03. Will the corresponding 95% confidence interval for μ include 0 in its midst? Will the 99% confidence interval for μ include 0? Explain your reasoning in each instance.
3. Menstrual cycle length. Menstrual cycle lengths (days) in an SRS of nine women are as follows: {31, 28, 26, 24, 29, 33, 25, 26, 28}. Use this data to test whether mean menstrual cycle length differs significantly from a lunar month using a one sample t-test. (A lunar month is 29.5 days.) Assume that population values vary according to a Normal distribution. Use a two-sided alternative. Show all hypothesis-testing steps.
4. Menstrual cycle length. Problem 3 calculated the mean length of menstrual cycles in an SRS of 9 women. The data revealed days with standard deviation s = 2.906 days. a) Calculate a 95% confidence interval for the mean menstrual cycle length. b) Based on the confidence interval you just calculated, is the mean menstrual cycle length significantly different from 28.5 days at α = 0.05 (two sided)? Is it significantly different from μ = 30 days at the same α-level? Explain your reasoning. (Section 10.4 in your text considered the relationship between confidence intervals and significance tests. The same rules apply here.)
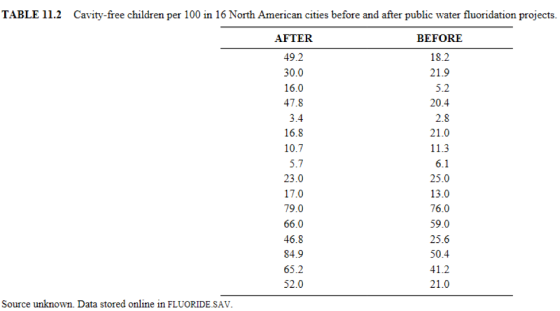
5. Water fluoridation. A study looked at the number of cavity-free children per 100 in 16 North American cities BEFORE and AFTER public water fluoridation projects. The table below lists the data. You will need to manually type the data into StatCrunch to use that tool to calculate the requested information.
a) Calculate delta values (After – Before) for each city. Then construct a stemplot or boxplot of these differences. Interpret your plot.
b) What percentage of cities showed an improvement in their cavity-free rate?
c) Estimate the mean change with 95% confidence (i.e. compute a 95% CI for the mean difference).
Homework Answers
Add Answer to:
1. Newborn weight. A study takes a SRS from a population of
full-term infants. The standard...
Menstrual cycle length.Menstrual cycle lengths (days) in an SRS of nine women are as follows: {31,...
Menstrual cycle length.Menstrual cycle lengths (days) in an SRS of nine women are as follows: {31, 28, 26, 24, 29, 33, 25, 26, 28}. Use this data to test whether mean menstrual cycle length differs significantly from a lunar month using a one sample t-test. (A lunar month is 29.5 days.) Assume that population values vary according to a Normal distribution. Use a two-sided alternative. Show all hypothesis-testing steps.
A study takes a simple random sample from a population of full-term infants. The standard deviation...
 A study takes a simple random sample from a population of full-term infants. The standard deviation of birth weights in this population is 2 pounds. Calculate 95% confidence intervals for the mean (u) for samples in which: Question 21. n=81 and x = 6.1 pounds A. (5.7 to 6.5) B. (6.3 to 7.7) C. (3.6 to 6.8) D. (4.5 to 7.1) Question 22. n= 36 and x = 7.0 pounds A. (5.7 to 6.5) B. (6.3 to 7.7) C. (3.6...
This is a two in one problem. I understand. Problem 9. But what is the last...
 This is a two in one problem. I understand. Problem 9. But
what is the last question asking
492886/quizi c us Quiz Learning Check #6 Search-Share More»> e se WhartstWeb Slice Gallery D Question 9 4 pts A test of Ho : μ 0 based on n-16 calculates tstat-2.44, what is the approximate one-sided P-value for the problem at an alpha level 5%? O 0.1 O 0.05 ○ 0075 .0.02 Question 10 10 pts Menstrual cycle lengths (days in an...
This is a two in one problem. I understand. Problem 9. But
what is the last question asking
492886/quizi c us Quiz Learning Check #6 Search-Share More»> e se WhartstWeb Slice Gallery D Question 9 4 pts A test of Ho : μ 0 based on n-16 calculates tstat-2.44, what is the approximate one-sided P-value for the problem at an alpha level 5%? O 0.1 O 0.05 ○ 0075 .0.02 Question 10 10 pts Menstrual cycle lengths (days in an...
10.1 A study reports that the mean birth weight of 81 full-term infants is 6.1 pounds....
 10.1 A study reports that the mean birth weight of 81 full-term infants is 6.1 pounds. The study also reports "SE-0.22 pounds." 95 a) What is the margin of error of this estimate for 95% confidence? b) What is the 95% confidence interval for ? c) What does it mean when we say that we have 95% confidence in the interval? d) Recall that SEX-in. Rearrange this equation to solve for σ. What was the standard deviation of birth weights...
A study was conducted to evaluate the effectiveness of a weight loss program. Among 36 obese indi...
 A study was conducted to evaluate the effectiveness of a weight loss program. Among 36 obese individuals aged 55 to 75 years randomly selected into the study, each individual had his/her BMI computed before and after the program. The decrease in the BMI was recorded into a SAS dataset and proc univariate was used to analyze this dataset. The population m ean of the decrease in the BMI is denoted by μ. Use the SAS output on the following page...
1. A random sample of n measurements was selected from a population with standard deviation σ=13.6...
1. A random sample of n measurements was selected from a population with standard deviation σ=13.6 and unknown mean μ. Calculate a 90 % confidence interval for μ for each of the following situations: (a) n=45, x¯¯¯=89.8 ≤μ≤ (b) n=70, x¯¯¯=89.8 ≤μ≤ (c) n=100, x¯¯¯=89.8 ≤μ≤ (d) In general, we can say that for the same confidence level, increasing the sample size the margin of error (width) of the confidence interval. (Enter: ''DECREASES'', ''DOES NOT CHANGE'' or ''INCREASES'', without the...
I need these questions answered please. 6. YChapter 11) In a pediatric clinic, a study is carried out to see how effective aspirin is in reducing temperature. Five 4-year-old children suffering...
 I need these questions answered please.
6. YChapter 11) In a pediatric clinic, a study is carried out to see how effective aspirin is in reducing temperature. Five 4-year-old children suffering from influenza had their temperature taken immediately before and 1 hour before administration of aspirin. Assuming the normality of data, we constructed 99% confidence interval for the mean difference in temperature before/after taking an aspirin. The 99% confidence interval is (-0.75, 3.95). If you perform the hypothesis test, what...
I need these questions answered please.
6. YChapter 11) In a pediatric clinic, a study is carried out to see how effective aspirin is in reducing temperature. Five 4-year-old children suffering from influenza had their temperature taken immediately before and 1 hour before administration of aspirin. Assuming the normality of data, we constructed 99% confidence interval for the mean difference in temperature before/after taking an aspirin. The 99% confidence interval is (-0.75, 3.95). If you perform the hypothesis test, what...
Please help me with my whole assigment 1. [7 marks in total] A statistics practitioner took...
 Please help me with my whole assigment
1. [7 marks in total] A statistics practitioner took a random sample of 31 observations from a normal population. The sample standard deviation is 34 and the sample mean is 97. Note: For each confidence interval, enter your answer in the form (LCL", UCL"). You must include the parentheses and the comma between the confidence limits. A. Estimate the population mean with 95% confidence. Diagram Confidence interval B. Estimate the population mean with...
Please help me with my whole assigment
1. [7 marks in total] A statistics practitioner took a random sample of 31 observations from a normal population. The sample standard deviation is 34 and the sample mean is 97. Note: For each confidence interval, enter your answer in the form (LCL", UCL"). You must include the parentheses and the comma between the confidence limits. A. Estimate the population mean with 95% confidence. Diagram Confidence interval B. Estimate the population mean with...
Part B: (41 points) Problem-Solving Suggestion: Report all final answers to 2 decimal points, carry 3...
 Part B: (41 points) Problem-Solving Suggestion: Report all final answers to 2 decimal points, carry 3 decimals for intermediate calculations. 1) The basal or resting heart rate typically has a mean of 70 standard deviation of 10 bpm. A sample of 25 students relaxing before the Bio-stat midterm measured a mea (Hint: first determine if this is a Z-test or t-test... Z-test if Population Std. Dev. Is k beats per minute (bpm) with a n = 75 nown) (6-pts) Construct...
 A study takes a simple random sample from a population of full-term infants. The standard deviation of birth weights in this population is 2 pounds. Calculate 95% confidence intervals for the mean (u) for samples in which: Question 21. n=81 and x = 6.1 pounds A. (5.7 to 6.5) B. (6.3 to 7.7) C. (3.6 to 6.8) D. (4.5 to 7.1) Question 22. n= 36 and x = 7.0 pounds A. (5.7 to 6.5) B. (6.3 to 7.7) C. (3.6...
 This is a two in one problem. I understand. Problem 9. But
what is the last question asking
492886/quizi c us Quiz Learning Check #6 Search-Share More»> e se WhartstWeb Slice Gallery D Question 9 4 pts A test of Ho : μ 0 based on n-16 calculates tstat-2.44, what is the approximate one-sided P-value for the problem at an alpha level 5%? O 0.1 O 0.05 ○ 0075 .0.02 Question 10 10 pts Menstrual cycle lengths (days in an...
This is a two in one problem. I understand. Problem 9. But
what is the last question asking
492886/quizi c us Quiz Learning Check #6 Search-Share More»> e se WhartstWeb Slice Gallery D Question 9 4 pts A test of Ho : μ 0 based on n-16 calculates tstat-2.44, what is the approximate one-sided P-value for the problem at an alpha level 5%? O 0.1 O 0.05 ○ 0075 .0.02 Question 10 10 pts Menstrual cycle lengths (days in an...
 10.1 A study reports that the mean birth weight of 81 full-term infants is 6.1 pounds. The study also reports "SE-0.22 pounds." 95 a) What is the margin of error of this estimate for 95% confidence? b) What is the 95% confidence interval for ? c) What does it mean when we say that we have 95% confidence in the interval? d) Recall that SEX-in. Rearrange this equation to solve for σ. What was the standard deviation of birth weights...
 10.1 A study reports that the mean birth weight of 81 full-term infants is 6.1 pounds. The study also reports "SE-0.22 pounds." 95 a) What is the margin of error of this estimate for 95% confidence? b) What is the 95% confidence interval for ? c) What does it mean when we say that we have 95% confidence in the interval? d) Recall that SEX-in. Rearrange this equation to solve for σ. What was the standard deviation of birth weights...
 A study was conducted to evaluate the effectiveness of a weight loss program. Among 36 obese individuals aged 55 to 75 years randomly selected into the study, each individual had his/her BMI computed before and after the program. The decrease in the BMI was recorded into a SAS dataset and proc univariate was used to analyze this dataset. The population m ean of the decrease in the BMI is denoted by μ. Use the SAS output on the following page...
 I need these questions answered please.
6. YChapter 11) In a pediatric clinic, a study is carried out to see how effective aspirin is in reducing temperature. Five 4-year-old children suffering from influenza had their temperature taken immediately before and 1 hour before administration of aspirin. Assuming the normality of data, we constructed 99% confidence interval for the mean difference in temperature before/after taking an aspirin. The 99% confidence interval is (-0.75, 3.95). If you perform the hypothesis test, what...
I need these questions answered please.
6. YChapter 11) In a pediatric clinic, a study is carried out to see how effective aspirin is in reducing temperature. Five 4-year-old children suffering from influenza had their temperature taken immediately before and 1 hour before administration of aspirin. Assuming the normality of data, we constructed 99% confidence interval for the mean difference in temperature before/after taking an aspirin. The 99% confidence interval is (-0.75, 3.95). If you perform the hypothesis test, what...
 Please help me with my whole assigment
1. [7 marks in total] A statistics practitioner took a random sample of 31 observations from a normal population. The sample standard deviation is 34 and the sample mean is 97. Note: For each confidence interval, enter your answer in the form (LCL", UCL"). You must include the parentheses and the comma between the confidence limits. A. Estimate the population mean with 95% confidence. Diagram Confidence interval B. Estimate the population mean with...
Please help me with my whole assigment
1. [7 marks in total] A statistics practitioner took a random sample of 31 observations from a normal population. The sample standard deviation is 34 and the sample mean is 97. Note: For each confidence interval, enter your answer in the form (LCL", UCL"). You must include the parentheses and the comma between the confidence limits. A. Estimate the population mean with 95% confidence. Diagram Confidence interval B. Estimate the population mean with...
 Part B: (41 points) Problem-Solving Suggestion: Report all final answers to 2 decimal points, carry 3 decimals for intermediate calculations. 1) The basal or resting heart rate typically has a mean of 70 standard deviation of 10 bpm. A sample of 25 students relaxing before the Bio-stat midterm measured a mea (Hint: first determine if this is a Z-test or t-test... Z-test if Population Std. Dev. Is k beats per minute (bpm) with a n = 75 nown) (6-pts) Construct...
Most questions answered within 3 hours.
-
The airline you’re flying on has an on-time rate of 76% for the
route you are...
asked 5 minutes ago -
What were the causes of the Cold War and why/how did the Soviet
Union eventually lose...
asked 5 minutes ago -
"People often resist change for reasons that make good sense to
them, even if those reasons...
asked 14 minutes ago -
Share your ideas and thoughts on how serial communications might
be used by graduates of your...
asked 13 minutes ago -
The return for Target stock next year will depend on the state
of the economy. The...
asked 15 minutes ago -
Economics Question:
Discuss the major pro and con for the independence of the
central bank from...
asked 22 minutes ago -
Complete the following sentence.
An elementary step is
A. a uni-, bi-, or termolecular reaction.
B....
asked 25 minutes ago -
Explain how to do the left edge algorithm in vlsi design
asked 26 minutes ago -
You are offered an investment that requires an up-front (time =
0) payment of £47,000. This...
asked 30 minutes ago -
A firm has an average investment of $1,000 during the year.
During the same time, the...
asked 30 minutes ago -
A 0.450-kg ice puck, moving east with a speed of 5.68 m/s , has
a head-on...
asked 36 minutes ago -
A diffraction grating has exactly 9000 slits equally
spaced across a total distance 1.10 cm. What...
asked 42 minutes ago