for the following data set answer the following: x=17,13,12,15,16,14,16,16,18,19 y=94,73,59,80,93,85,66,79,77,91 a)prepare a scatter plot b)calculate an...
for the following data set answer the following:
x=17,13,12,15,16,14,16,16,18,19
y=94,73,59,80,93,85,66,79,77,91
a)prepare a scatter plot
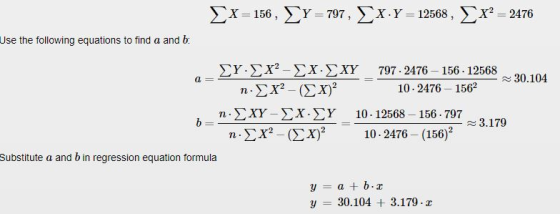
b)calculate an expression for the regression line
c)calculate the correlation coefficient r
d)calculate the coefficient of determination r^2
e)test the hypothesis (H0=P=0; Ha P does not equal 0) for sigma=0.05 using your determine value of r and online t tables.
Please show work!!!
Homework Answers
a) Scatter Plot
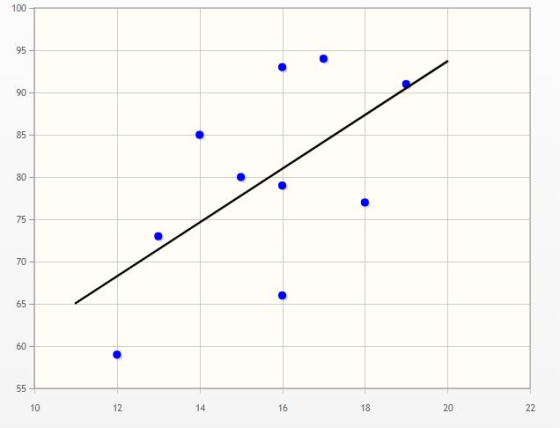
b) Regression line
c) Correlation Coefficient

d) R2 = 0.59612 = 0.355
e) 

df = 8
The critical value of r is 0.632
Since r calculated is less than r tabulated. Fail to Reject H0
Hence there is no linear relationship exists between X and Y
Add Answer to:
for the following data set answer the following:
x=17,13,12,15,16,14,16,16,18,19
y=94,73,59,80,93,85,66,79,77,91
a)prepare a scatter plot
b)calculate an...
For the following data (a) display the data in a scatter plot, (b) calculate the correlation...
 For the following data (a) display the data in a scatter plot, (b) calculate the correlation coefficient r, and (c) make a conclusion about the type of correlation. The ages (in years) of 6 children and the number of words in their vocabulary Age, x 1. 2 3 4 5 6 Vocabulary size, y 500 450 1350 1750 2300 2300 (a) Choose the correct scatter plot below. A. B. c. D. 2350+.. 7 2350- 2350- Vocabulary Age Vocabulary Vocabulary ....
For the following data (a) display the data in a scatter plot, (b) calculate the sample...
For the following data (a) display the data in a scatter plot, (b) calculate the sample correlation coefficient r, and (c) make a conclusion about the type of correlation. Use technology. The earnings per share (in dollars) and the dividends per share (in dollars) for six medical supplies companies in a recent year are shown in the data set below. a) choose the correct scatter plot. Use technology. (b) The correlation coefficient r is _____ (Round to three decimal places...
For the following data (a) display the data in a scatter plot, (b) calculate the sample correla...
For the following data (a) display the data in a scatter plot, (b) calculate the sample correlation coefficient r, and (c) make a conclusion about the type of correlation. Use technology. The earnings per share (in dollars) and the dividends per share (in dollars) for six medical supplies companies in a recent year are shown in the data set below. a) choose the correct scatter plot. Use technology. (b) The correlation coefficient r is _____ (Round to three decimal places...
For the following data (a) display the data in a scatter plot, (b) calculate the correlation...
 For the following data (a) display the data in a scatter plot, (b) calculate the correlation coefficient r, and (c) make a conclusion about the type of correlation. The ages (in years) of 6 children and the number of words in their vocabulary Age, x 1 2 3 4 5 6 Vocabulary size, y 300 450 1500 1500 2300 2400 a Ag Vocab Vocab Vocabi . 2450 Vocabulary Age Age Age (b) The correlation coefficient r is (Round to three...
For the following data (a) display the data in a scatter plot, (b) calculate the sample...
 For the following data (a) display the data in a scatter plot, (b) calculate the sample correlation coefficient r, and (c) make a conclusion about the type of correlation. Use technology. The eamings per share (in dollars) and the dividends per share (in dollars) for 6 medical supplies companies in a recent year are shown in the data set below. Earnings per share, x 2.74 5.05 Dividends per share,0.56 2.39 4.53 3.02 3.73 2.25 1.46 0.89 1.06 0.27 v (a)...
For MATLAB 3. write a program to plot a scatter plot of data (x, y) pairs...
 For MATLAB
3. write a program to plot a scatter plot of data (x, y) pairs and compute the correlation coefficient. Data and details are provided below. In Lecture 9 it was noted that the numerator used in the sample variance could be obtained using the sum(x) and sum(x. 'x) functions: iz1 The average is sum(x)/n. If an array y of the same length is computed in the same way call that term Syy. The term Sxy can be computed...
For MATLAB
3. write a program to plot a scatter plot of data (x, y) pairs and compute the correlation coefficient. Data and details are provided below. In Lecture 9 it was noted that the numerator used in the sample variance could be obtained using the sum(x) and sum(x. 'x) functions: iz1 The average is sum(x)/n. If an array y of the same length is computed in the same way call that term Syy. The term Sxy can be computed...
answer c-e 2. Consider the following ordered pairs a. First draw a scatter plot with this...
 answer c-e
2. Consider the following ordered pairs a. First draw a scatter plot with this information LHHHH b. Then write the equation of a line. O i 234567 Y=9.5-0.58 c. Calculate the slope and y intercept for the linear regression equation d. Calculate the SST e. Partition the SST into SSR and SSE f. Calculate the coefficient of determination
answer c-e
2. Consider the following ordered pairs a. First draw a scatter plot with this information LHHHH b. Then write the equation of a line. O i 234567 Y=9.5-0.58 c. Calculate the slope and y intercept for the linear regression equation d. Calculate the SST e. Partition the SST into SSR and SSE f. Calculate the coefficient of determination
You generate a scatter plot using Excel. You then have Excel plot the trend line and...
 You generate a scatter plot using Excel. You then have Excel plot the trend line and report the equation and the r2 value. The regression equation is reported as y 63.79x 13.96 and the r2 = 0.4356. What is the correlation coefficient for this data set?
For each of the data sets, create a scatter plot with the regression line and answer...
For each of the data sets, create a scatter plot with the regression line and answer these questions What is r, r^2, Critical Value (CV)? In general, what does r^2 mean? What does r^2 mean specifically for the data set? What is the regression equation? Is there any positive or negative correlation? Interpret b1. Interpret b0. Forecast the next year. Model your answers off the Excel file of the solutions found under Content, 3B
13 The scatter plot for the data set X and Y shows the data points clustered...
 13 The scatter plot for the data set X and Y shows the data points clustered in a nearly perfect circle. For these data, what is the most likely value for the Pearson r? a) near 0 b) r near +1 c) r near - 1 d) r between - 5 and 7.5 e) none of the above.
 For the following data (a) display the data in a scatter plot, (b) calculate the correlation coefficient r, and (c) make a conclusion about the type of correlation. The ages (in years) of 6 children and the number of words in their vocabulary Age, x 1. 2 3 4 5 6 Vocabulary size, y 500 450 1350 1750 2300 2300 (a) Choose the correct scatter plot below. A. B. c. D. 2350+.. 7 2350- 2350- Vocabulary Age Vocabulary Vocabulary ....
 For the following data (a) display the data in a scatter plot, (b) calculate the correlation coefficient r, and (c) make a conclusion about the type of correlation. The ages (in years) of 6 children and the number of words in their vocabulary Age, x 1 2 3 4 5 6 Vocabulary size, y 300 450 1500 1500 2300 2400 a Ag Vocab Vocab Vocabi . 2450 Vocabulary Age Age Age (b) The correlation coefficient r is (Round to three...
 For the following data (a) display the data in a scatter plot, (b) calculate the sample correlation coefficient r, and (c) make a conclusion about the type of correlation. Use technology. The eamings per share (in dollars) and the dividends per share (in dollars) for 6 medical supplies companies in a recent year are shown in the data set below. Earnings per share, x 2.74 5.05 Dividends per share,0.56 2.39 4.53 3.02 3.73 2.25 1.46 0.89 1.06 0.27 v (a)...
 For MATLAB
3. write a program to plot a scatter plot of data (x, y) pairs and compute the correlation coefficient. Data and details are provided below. In Lecture 9 it was noted that the numerator used in the sample variance could be obtained using the sum(x) and sum(x. 'x) functions: iz1 The average is sum(x)/n. If an array y of the same length is computed in the same way call that term Syy. The term Sxy can be computed...
For MATLAB
3. write a program to plot a scatter plot of data (x, y) pairs and compute the correlation coefficient. Data and details are provided below. In Lecture 9 it was noted that the numerator used in the sample variance could be obtained using the sum(x) and sum(x. 'x) functions: iz1 The average is sum(x)/n. If an array y of the same length is computed in the same way call that term Syy. The term Sxy can be computed...
 answer c-e
2. Consider the following ordered pairs a. First draw a scatter plot with this information LHHHH b. Then write the equation of a line. O i 234567 Y=9.5-0.58 c. Calculate the slope and y intercept for the linear regression equation d. Calculate the SST e. Partition the SST into SSR and SSE f. Calculate the coefficient of determination
answer c-e
2. Consider the following ordered pairs a. First draw a scatter plot with this information LHHHH b. Then write the equation of a line. O i 234567 Y=9.5-0.58 c. Calculate the slope and y intercept for the linear regression equation d. Calculate the SST e. Partition the SST into SSR and SSE f. Calculate the coefficient of determination
 You generate a scatter plot using Excel. You then have Excel plot the trend line and report the equation and the r2 value. The regression equation is reported as y 63.79x 13.96 and the r2 = 0.4356. What is the correlation coefficient for this data set?
 13 The scatter plot for the data set X and Y shows the data points clustered in a nearly perfect circle. For these data, what is the most likely value for the Pearson r? a) near 0 b) r near +1 c) r near - 1 d) r between - 5 and 7.5 e) none of the above.
Most questions answered within 3 hours.
-
Given that many conflict are the result of different parties having
different interests, is it possible...
asked 4 seconds from now -
A 750 g block can slide uniformly along the horizontal track
when a string attached to...
asked 2 minutes ago -
In 2017, Juan entered into a contract to write a book. The
publisher advanced Juan $50,000,...
asked 16 minutes ago -
Determine the number of kinds of protons in each molecule (w/
respect to NMR spectroscopy). Drawing...
asked 26 minutes ago -
A jeweler whose near point is 68 cm from his eye uses a
magnifying glass as...
asked 24 minutes ago -
A company wants to determine how many units of each of two
products, A and B,...
asked 28 minutes ago -
The blood pressure of a person changes throughout the day.
Suppose the systolic blood pressure of...
asked 37 minutes ago -
A chemistry student desired to study sulfur. Sulfur exhibited
the following characteristics with oxygen:
(a) It...
asked 33 minutes ago -
An Atwood machine is constructed of a solid-disk frictionless
pulley of mass m3 and radius R....
asked 35 minutes ago -
what are the advantages of lanthanum hexaboride over tungsten
filament for electron emission
what is the...
asked 36 minutes ago -
Question 5
Your uncle offers to sell you his vintage Rolls Royce. He
suggests a payment...
asked 41 minutes ago -
Quality grading of beef products as Prime, Choice, Select. What
type of data?
A) ratio
B)...
asked 50 minutes ago