
Homework Answers


![165 get, h(63-1653 D.8 49หุ้+1] +많 +36v_ 9.j.. (6.my →2.89 V40 +06 28 3 2](http://img.homeworklib.com/questions/36c8ab10-97b2-11eb-b3a6-677a36a459e8.png?x-oss-process=image/resize,w_560)

Add Answer to:
6.28 Consider the simplified electric power system shown in Figure 6.17 for which the power- flow...
A balanced three-phase two-bus power system, with Sa 100 MVA, VB-100kV, is as below Bus 1...
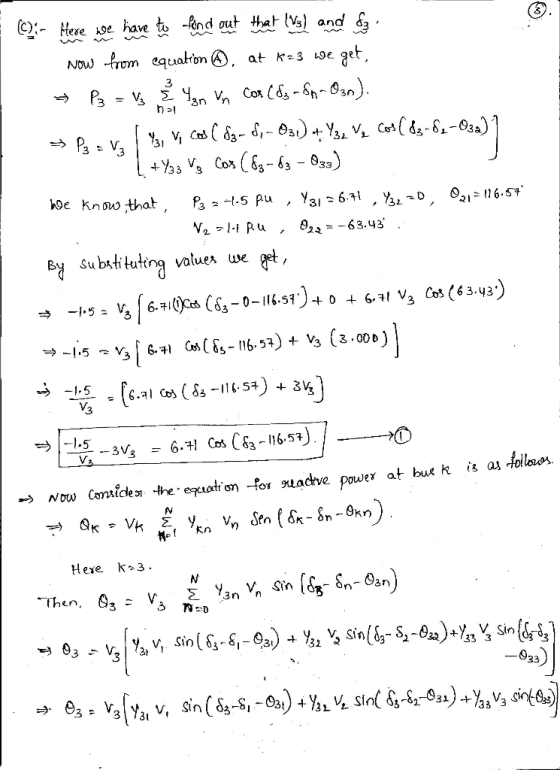
 A balanced three-phase two-bus power system, with Sa 100 MVA, VB-100kV, is as below Bus 1 Bus 2 Sp :120MVA K=10220. kv = 10220 kV KI2Gp.u 闷く0, p.u↓ @pf 0.8 lagging (a) Using the per unit analysis, formulate the YBus matrix for the system. (b) Determine the set of power flow equations of real and reactive power balance at Bus-2, in terms of state variables of (e,,
Question1 A power system is shown in figure below. The generators at buses 1 and 2...
 Question1 A power system is shown in figure below. The generators at buses 1 and 2 are represented by their equivalent voltage and current sources wh their reactances in per unit respectively. The lines are represented by π model where series reactances and shunt reactances are also expressed in per unit. (a) Convert network impedances to admittances. (b) Obtain the Ybus (i.e., bus admittance matrix) by inspection. 0.4 /0.5 G1 0.2 0.25 0.3 0.15 4
6.1 Consider the power system shown in Figure P6.1. Assuming that the only lim- itations imposed by the network are imposed by the thermal capacity of the transmission lines and that the reactive pow...
 6.1 Consider the power system shown in Figure P6.1. Assuming that the only lim- itations imposed by the network are imposed by the thermal capacity of the transmission lines and that the reactive power flows are negligible, check that the following sets of transactions are simultaneously feasible. Seller Amount Set 1 Set 2 Set 3 1000 100 -0.2 pu. AX 250 MW X3-0.4 p.u PMAX-250 MW X23-04 р.u. PMAX 250 MW Figure P6.1 Three-bus power system for Problem 6.1
6.1...
6.1 Consider the power system shown in Figure P6.1. Assuming that the only lim- itations imposed by the network are imposed by the thermal capacity of the transmission lines and that the reactive power flows are negligible, check that the following sets of transactions are simultaneously feasible. Seller Amount Set 1 Set 2 Set 3 1000 100 -0.2 pu. AX 250 MW X3-0.4 p.u PMAX-250 MW X23-04 р.u. PMAX 250 MW Figure P6.1 Three-bus power system for Problem 6.1
6.1...
Exercise 3 Consider a 2 generator 4 bus power system shown in Figure E3. The impedance data of the network in p.u. are given in Figure E3. A bolted symmetrical three phase fault occurs at bus 4. Assu...
 Exercise 3 Consider a 2 generator 4 bus power system shown in Figure E3. The impedance data of the network in p.u. are given in Figure E3. A bolted symmetrical three phase fault occurs at bus 4. Assuming the prefault bus voltages as I p.u., calculate the fault current and the current delivered by the generators during the fault and the bus voltages during the fault. j0.12 0.05 0.16 j0.18 j0.12 0.15 0.05 j0.12 j0.1 j0.14 4 (2 Figure E3:...
The data of the sample power system shown in Figure 2 are given in Tables 1 and 2.
 The data of the sample power system shown in figure 2 are given in Tables 1 and 2. These data were entered into a load flow program using a 100MVA power base. Convergence was obtained and the program gave the following bus voltages:V1=1.04<0,V2=1.0<-2.78806 p.u. and V3=0.9161<-6.99713p.u. Find:a. The real power flow in the three transmission lines (indicate the values on the diagram)b. The total real power lossesQ2.pdf
Given the single phase power system shown in Figure 2, determine the following (use 240 V_base...
 Given the single phase power system shown in Figure 2, determine the following (use 240 V_base and 30 kVA S_ base for the system at Bus 1): a) Draw the per-unit circuit b) Determine the per-unit impedances and per-unit source voltage c) Calculate the load current in both per-unit and in amperes at Bus 3 d) Calculate the apparent power, real power, reactive power and power factor at Bus 1
The six-bus system shown in Figure 1 will be simulated using MATLAB. Transmission line data and b...
 The six-bus system shown in Figure 1 will be simulated using MATLAB. Transmission line data and bus data are given in Tables 1 and 2 respectively. The transmission line data are calculated on 100 MVA base and 230 (line-to-line) kV base for generator. Tasks: 1. Determine the network admittance matrix Y 2. Find the load flow solution using Gauss-Seidel/Newton Raphson method until first iteration by manual calculation. Use Maltab software to solve power flow problem using Gauss-Seidel method. Find the...
1. In the power system network shown in Figure 1, Vi bus 1 is a slack bus with 1.00 per unit and bus 2 is a load bus wi...
 1. In the power system network shown in Figure 1, Vi bus 1 is a slack bus with 1.00 per unit and bus 2 is a load bus with S2 Mvar. The line impedance on a base of 100 MVA is Z = 0.02 + j0.04 per unit (a) Using Gauss-Seidel method, determine V2 . Use an initial estimate of V=1.0j0.0 and perform four iterations (b) If after several iterations voltage at bus 2 converges to V2 = 0.90-j0.10, determine...
 A balanced three-phase two-bus power system, with Sa 100 MVA, VB-100kV, is as below Bus 1 Bus 2 Sp :120MVA K=10220. kv = 10220 kV KI2Gp.u 闷く0, p.u↓ @pf 0.8 lagging (a) Using the per unit analysis, formulate the YBus matrix for the system. (b) Determine the set of power flow equations of real and reactive power balance at Bus-2, in terms of state variables of (e,,
 Question1 A power system is shown in figure below. The generators at buses 1 and 2 are represented by their equivalent voltage and current sources wh their reactances in per unit respectively. The lines are represented by π model where series reactances and shunt reactances are also expressed in per unit. (a) Convert network impedances to admittances. (b) Obtain the Ybus (i.e., bus admittance matrix) by inspection. 0.4 /0.5 G1 0.2 0.25 0.3 0.15 4
 6.1 Consider the power system shown in Figure P6.1. Assuming that the only lim- itations imposed by the network are imposed by the thermal capacity of the transmission lines and that the reactive power flows are negligible, check that the following sets of transactions are simultaneously feasible. Seller Amount Set 1 Set 2 Set 3 1000 100 -0.2 pu. AX 250 MW X3-0.4 p.u PMAX-250 MW X23-04 р.u. PMAX 250 MW Figure P6.1 Three-bus power system for Problem 6.1
6.1...
6.1 Consider the power system shown in Figure P6.1. Assuming that the only lim- itations imposed by the network are imposed by the thermal capacity of the transmission lines and that the reactive power flows are negligible, check that the following sets of transactions are simultaneously feasible. Seller Amount Set 1 Set 2 Set 3 1000 100 -0.2 pu. AX 250 MW X3-0.4 p.u PMAX-250 MW X23-04 р.u. PMAX 250 MW Figure P6.1 Three-bus power system for Problem 6.1
6.1...
 Exercise 3 Consider a 2 generator 4 bus power system shown in Figure E3. The impedance data of the network in p.u. are given in Figure E3. A bolted symmetrical three phase fault occurs at bus 4. Assuming the prefault bus voltages as I p.u., calculate the fault current and the current delivered by the generators during the fault and the bus voltages during the fault. j0.12 0.05 0.16 j0.18 j0.12 0.15 0.05 j0.12 j0.1 j0.14 4 (2 Figure E3:...
 Given the single phase power system shown in Figure 2, determine the following (use 240 V_base and 30 kVA S_ base for the system at Bus 1): a) Draw the per-unit circuit b) Determine the per-unit impedances and per-unit source voltage c) Calculate the load current in both per-unit and in amperes at Bus 3 d) Calculate the apparent power, real power, reactive power and power factor at Bus 1
 The six-bus system shown in Figure 1 will be simulated using MATLAB. Transmission line data and bus data are given in Tables 1 and 2 respectively. The transmission line data are calculated on 100 MVA base and 230 (line-to-line) kV base for generator. Tasks: 1. Determine the network admittance matrix Y 2. Find the load flow solution using Gauss-Seidel/Newton Raphson method until first iteration by manual calculation. Use Maltab software to solve power flow problem using Gauss-Seidel method. Find the...
 1. In the power system network shown in Figure 1, Vi bus 1 is a slack bus with 1.00 per unit and bus 2 is a load bus with S2 Mvar. The line impedance on a base of 100 MVA is Z = 0.02 + j0.04 per unit (a) Using Gauss-Seidel method, determine V2 . Use an initial estimate of V=1.0j0.0 and perform four iterations (b) If after several iterations voltage at bus 2 converges to V2 = 0.90-j0.10, determine...
Most questions answered within 3 hours.
-
Why [M(CN)6] is not organometallic even it has metal
to carbon bond too
asked 3 minutes ago -
mstar electric has a bond issue outstanding that has a 20 year
life, a $1,000 par...
asked 10 minutes ago -
This is a Business Writing Question:
Common Types of Faulty Sentence Logic:
A. Mixed constructions
B....
asked 11 minutes ago -
Skinner asserts that science, and the common view of science, has
been tarnished. Explain his evidence...
asked 14 minutes ago -
Question 3 (1 point)
Fill in the blank. Speed Car Rental company found that the tire...
asked 14 minutes ago -
An short-seller in Tesla is worried the latest management
earnings forecast is too aggressive and the...
asked 15 minutes ago -
A grocery store's receipts show that Sunday customer purchases
have a skewed distribution with a mean...
asked 20 minutes ago -
A 0.035 mol sample of a weak acid, HA, is dissolved in 437 mL of
water...
asked 32 minutes ago -
a sample of Ar gas has a volume of 6.30 L with an unknown
pressure. the...
asked 33 minutes ago -
The
serum cholesterol levels of a population of kids follow a normal
distribution with mean 155...
asked 52 minutes ago -
han discusses the racist practice of badlands, a bar
in the Castro
district of San Francisco,...
asked 1 hour ago -
A sample of final exam scores is normally distributed with a
mean equal to 25 and...
asked 1 hour ago