Use linear regression to find the equation for the linear function that best fits this data. Round both numbers to two decimal places. Write your final answer in a form of an equation....
...y = mx+b

Homework Answers
Solution :
| X | Y | XY | X^2 | Y^2 |
| 1 | 72 | 72 | 1 | 5184 |
| 2 | 91 | 182 | 4 | 8281 |
| 3 | 125 | 375 | 9 | 15625 |
| 4 | 136 | 544 | 16 | 18496 |
| 5 | 172 | 860 | 25 | 29584 |
| 6 | 194 | 1164 | 36 | 37636 |
| n | 6 |
| sum(XY) | 3197.00 |
| sum(X) | 21.00 |
| sum(Y) | 790.00 |
| sum(X^2) | 91.00 |
| sum(Y^2) | 114806.00 |
| Numerator | 2592.00 |
| Denominator | 2607.16 |
| r | 0.9942 |
| r square | 0.9884 |
| Xbar(mean) | 3.5000 |
| Ybar(mean) | 131.6667 |
| SD(X) | 1.7078 |
| SD(Y) | 42.4055 |
| b | 24.6857 |
| a | 45.2667 |
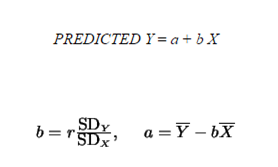
y = 24.69 x + 45.27
Add Answer to:
Use linear regression to find the equation for the linear
function that best fits this data....
Use quadratic regression and a graphing calculator to find the quadratic function that best fits the...
 Use quadratic regression and a graphing calculator to find the quadratic function that best fits the data set. Then use the model to forecast the value of the function at the indicated point. (Round your coeffiecients to two decimal places.) Years Since 1985 Abortion:s (per 1000 live births) 0 5 10 15 16 17 422 389 350 324 325 319 What was the abortion rate in 2007? (Round your answer to the nearest whole number.) abortion:s
x 1 2 3 4 5 6 y 1007 1799 2872 5027 8022 13619 Use linear...
x 1 2 3 4 5 6 y 1007 1799 2872 5027 8022 13619 Use linear regression to find the equation for the linear function that best fits this data. Round to two decimal places. y^( y-hat) = ? Hint: Enter the data into L1 And L2 then in STAT CALC select 8:LinReg(a+bx)
Linear Regression and Prediction perform a linear regression to determine the line-of-best fit. Use weight as...
Linear Regression and Prediction perform a linear regression to determine the line-of-best fit. Use weight as your x (independent) variable and braking distance as your y (response) variable. Use four (4) places after the decimal in your answer. Sample size, n: 21 Degrees of freedom: 19 Correlation Results: Correlation coeff, r: 0.3513217 Critical r: ±0.4328579 P-value (two-tailed): 0.11837 Regression Results: Y= b0 + b1x: Y Intercept, b0: 125.308 Slope, b1: 0.0031873 Total Variation: 458.9524 Explained Variation: 56.6471 Unexplained Variation: 402.3053...
Due Fri 04/10/2020 11:59 pm Show Intro/Instructions Use exponential regression to find an exponential function that...
 Due Fri 04/10/2020 11:59 pm Show Intro/Instructions Use exponential regression to find an exponential function that best fits this data. f(x) = Preview Use linear regression to find an linear function that best fits this data. g(x)= Preview Of these two, which equation best fits the data? Exponential Linear Get help: Video Points possible: 7 This is attempt 1 of 3. ote 5 ⓇW 9
Use the given data set to answer parts (a) and (b) a. Find the regression equation...
 Use the given data set to answer parts (a) and (b) a. Find the regression equation for the data points b. Graph the regression equation and the data points a Find the regression equation for the data points (Use integers or decimals for any numbers in the expression. Round to two decimal places as needed) b. Graph the regression equation and the data points OA. B. O D. of
Find the equation of the regression line for the given data. Then construct a scatter plot...
 Find the equation of the regression line for the given data. Then construct a scatter plot of the data and draw the regression line. (The pair of variables have a significa correlation.) Then use the regression equation to predict the value of y for each of the given x-values, if meaningful. The table below shows the heights (in feet) and the number of stories of six notable buildings in a city. Height, x 758 621 518 510 492 483 (a)...
Use the given data set to answer parts (a) and (b). a. Find the regression equation for the data points. b. Graph the r...
 Use the given data set to answer parts (a) and (b). a. Find the regression equation for the data points. b. Graph the regression equation and the data points. x 5 y -2 3 1 3-2 4 4 2 6 a. Find the regression equation for the data points. (Use integers or decimals for any numbers in the expression. Round to two decimal places as needed.) b. Graph the regression equation and the data points. OA. 50 O c. 10...
Find the linear regression line for the following table of values. You will need to use...
 Find the linear regression line for the following table of values. You will need to use a calculator, spreadsheet, or statistica software. Enter your answer in the form y = mx +b, with m and b both rounded to two decimal places. х 3 4 5 6 у 6.03 9.65 11.49 11.57 12.96 14.97 16.31 17.43 18.55 7 8 9 DI 10 11 « Previous Ne
1. 2. 3. Use the given data to find the equation of the regression line. Examine...
 1.
2.
3.
Use the given data to find the equation of the regression line. Examine the scatterplot and identify a characteristic of the data that is ignored by the regression line. X 5 14 13.31 13 13.66 12 13.74 10 13.05 9 12.30 4 4.31 6 8.34 8 11.25 11 13.54 7 9.94 y 6.46 = 3.00 + 0.80 (Round to two decimal places as needed.) The data show the chest size and weight of several bears. Find the...
1.
2.
3.
Use the given data to find the equation of the regression line. Examine the scatterplot and identify a characteristic of the data that is ignored by the regression line. X 5 14 13.31 13 13.66 12 13.74 10 13.05 9 12.30 4 4.31 6 8.34 8 11.25 11 13.54 7 9.94 y 6.46 = 3.00 + 0.80 (Round to two decimal places as needed.) The data show the chest size and weight of several bears. Find the...
Linear Regression Application, Interpolation and Extrapolation Use the data and story to answer the following questions...
 Linear Regression Application, Interpolation and Extrapolation Use the data and story to answer the following questions The table below shows the number of state-registered automatic weapons and the murder rate for several Northwestern states. * 11.6 14.2 8.1 11.2 7.2 10.2 3.9 2.9 7.1 6.7 2.3 6.1 2.5 6.2 0.5 4.2 x = thousands of automatic weapons y = murders per 100,000 residents Use your calculator to determine the equation of the regression line. (Round to 2 decimal places) Determine...
 Use quadratic regression and a graphing calculator to find the quadratic function that best fits the data set. Then use the model to forecast the value of the function at the indicated point. (Round your coeffiecients to two decimal places.) Years Since 1985 Abortion:s (per 1000 live births) 0 5 10 15 16 17 422 389 350 324 325 319 What was the abortion rate in 2007? (Round your answer to the nearest whole number.) abortion:s
 Due Fri 04/10/2020 11:59 pm Show Intro/Instructions Use exponential regression to find an exponential function that best fits this data. f(x) = Preview Use linear regression to find an linear function that best fits this data. g(x)= Preview Of these two, which equation best fits the data? Exponential Linear Get help: Video Points possible: 7 This is attempt 1 of 3. ote 5 ⓇW 9
 Use the given data set to answer parts (a) and (b) a. Find the regression equation for the data points b. Graph the regression equation and the data points a Find the regression equation for the data points (Use integers or decimals for any numbers in the expression. Round to two decimal places as needed) b. Graph the regression equation and the data points OA. B. O D. of
 Find the equation of the regression line for the given data. Then construct a scatter plot of the data and draw the regression line. (The pair of variables have a significa correlation.) Then use the regression equation to predict the value of y for each of the given x-values, if meaningful. The table below shows the heights (in feet) and the number of stories of six notable buildings in a city. Height, x 758 621 518 510 492 483 (a)...
 Use the given data set to answer parts (a) and (b). a. Find the regression equation for the data points. b. Graph the regression equation and the data points. x 5 y -2 3 1 3-2 4 4 2 6 a. Find the regression equation for the data points. (Use integers or decimals for any numbers in the expression. Round to two decimal places as needed.) b. Graph the regression equation and the data points. OA. 50 O c. 10...
 Find the linear regression line for the following table of values. You will need to use a calculator, spreadsheet, or statistica software. Enter your answer in the form y = mx +b, with m and b both rounded to two decimal places. х 3 4 5 6 у 6.03 9.65 11.49 11.57 12.96 14.97 16.31 17.43 18.55 7 8 9 DI 10 11 « Previous Ne
 1.
2.
3.
Use the given data to find the equation of the regression line. Examine the scatterplot and identify a characteristic of the data that is ignored by the regression line. X 5 14 13.31 13 13.66 12 13.74 10 13.05 9 12.30 4 4.31 6 8.34 8 11.25 11 13.54 7 9.94 y 6.46 = 3.00 + 0.80 (Round to two decimal places as needed.) The data show the chest size and weight of several bears. Find the...
1.
2.
3.
Use the given data to find the equation of the regression line. Examine the scatterplot and identify a characteristic of the data that is ignored by the regression line. X 5 14 13.31 13 13.66 12 13.74 10 13.05 9 12.30 4 4.31 6 8.34 8 11.25 11 13.54 7 9.94 y 6.46 = 3.00 + 0.80 (Round to two decimal places as needed.) The data show the chest size and weight of several bears. Find the...
 Linear Regression Application, Interpolation and Extrapolation Use the data and story to answer the following questions The table below shows the number of state-registered automatic weapons and the murder rate for several Northwestern states. * 11.6 14.2 8.1 11.2 7.2 10.2 3.9 2.9 7.1 6.7 2.3 6.1 2.5 6.2 0.5 4.2 x = thousands of automatic weapons y = murders per 100,000 residents Use your calculator to determine the equation of the regression line. (Round to 2 decimal places) Determine...
Most questions answered within 3 hours.
-
Based on the range, which of the following sets of scores has
the greatest variability? 3,...
asked 1 hour ago -
Ripples in a pond travel at a velocity of 3 m/s with one peak
passing a...
asked 52 minutes ago -
A man stands on the roof of a building of height 13.0 mm and
throws a...
asked 58 minutes ago -
The extent to which assets are financed by borrowed funds and
other liabilities is indicated by:...
asked 2 hours ago -
Explain in detail
Germany is the fifth largest economy
explain what goods and services Germany specializes...
asked 2 hours ago -
The density of platinum is 21.45 g/mL. If a cube of platinum
with a mass of...
asked 2 hours ago -
Accounts Receivable
Sales
A/R Posting
Extended Sales Invoice
Packing Slip
Compare invoice to packing slip 2...
asked 2 hours ago -
Michaella, age 23, is a full-time law student and is claimed by
her parents as a...
asked 2 hours ago -
Why are polymers not typically casted into products?
asked 2 hours ago -
When rolling a die 129 times, what is the probability of rolling
a 6 no more...
asked 2 hours ago -
4. A call option currently sells for $7.75. It has a strike
price of $85 and...
asked 2 hours ago -
1.
You need to prepare 10.0 liters of an acid aqueous solution with a
pH of...
asked 2 hours ago