
Homework Answers
Chart option D is correct
B0 = -34.98
B1 = 1.34
In excel go to data tab choose data analysis and run regression statistics.

Add Answer to:
c. predict the mean cost per person for a restaurant summated
rating of 30.
A magazine...
HOW DO YOU FIND B0 AND B1? A magazine publishes restaurant ratings for various locations around...
 HOW DO YOU FIND B0 AND B1?
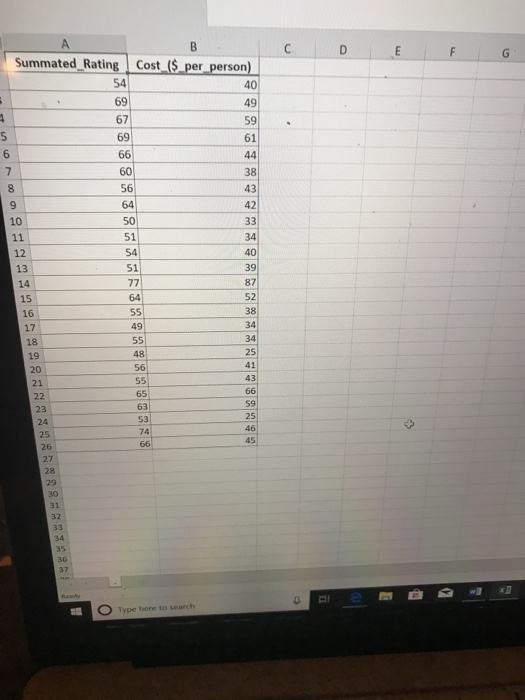
A magazine publishes restaurant ratings for various locations around the world. The magazine rates the restaurants for food, decor, service, and the cost per person. Develop a regression model to predict the cost per person, based on a variable that represents the sum of the three ratings. The magazine has compiled the accompanying table of this summated ratings variable and the cost per person for 25 restaurants in a major city. Complete parts...
HOW DO YOU FIND B0 AND B1?
A magazine publishes restaurant ratings for various locations around the world. The magazine rates the restaurants for food, decor, service, and the cost per person. Develop a regression model to predict the cost per person, based on a variable that represents the sum of the three ratings. The magazine has compiled the accompanying table of this summated ratings variable and the cost per person for 25 restaurants in a major city. Complete parts...
A magazine publishes restaurant ratings for various locations around the world. The magazine rates the restaurants...
 A magazine publishes restaurant ratings for various locations around the world. The magazine rates the restaurants for food, decor, service, and the cost per person. Develop a regression model to predict the cost per person, based on a variable that represents the sum of the three ratings. The magazine has compiled the accompanying table of this summated ratings variable and the cost per person for 25 restaurants in a major city. Complete parts (a) through (c) below. Click the icon...
continued table.. Will rate, thank you in advance. A magazine publishes restaurant ratings for various locations...
 continued table..
Will rate, thank you in advance.
A magazine publishes restaurant ratings for various locations around the world. The magazine rates the restaurants for food, decor, service, and the cost per person. Develop a regression model to predict the cost per person, based on a variable that represents the sum of the three ratings. The magazine has compiled the accompanying table of this summated ratings variable and the cost per person for 25 restaurants in a major city. Complete...
continued table..
Will rate, thank you in advance.
A magazine publishes restaurant ratings for various locations around the world. The magazine rates the restaurants for food, decor, service, and the cost per person. Develop a regression model to predict the cost per person, based on a variable that represents the sum of the three ratings. The magazine has compiled the accompanying table of this summated ratings variable and the cost per person for 25 restaurants in a major city. Complete...
Help solve (b) please Calibri 11 BIU Homework: Homework Chapter 13: Simple Linear Regression Save E6...
 Help solve (b) please
Calibri 11 BIU Homework: Homework Chapter 13: Simple Linear Regression Save E6 fr L'a A B C D Score: 0.17 of 1 pt 1 of 5 (4 complete) HW Score: 39.09%, 1.95 of 5 p. Summated Rating costs per person 54 id 13.2.5-T تع 69 i 2 Question Help 52 61 6d 4 es 66 6 61 41 oc 40 Amagazine publishes restaurant ratings for various locations around the world. The magazine rates the restaurants for...
Help solve (b) please
Calibri 11 BIU Homework: Homework Chapter 13: Simple Linear Regression Save E6 fr L'a A B C D Score: 0.17 of 1 pt 1 of 5 (4 complete) HW Score: 39.09%, 1.95 of 5 p. Summated Rating costs per person 54 id 13.2.5-T تع 69 i 2 Question Help 52 61 6d 4 es 66 6 61 41 oc 40 Amagazine publishes restaurant ratings for various locations around the world. The magazine rates the restaurants for...
A magazine used the summated rating of 10 restaurants to predict the cost of a restaurant...
 A magazine used the summated rating of 10 restaurants to predict the cost of a restaurant meal. For that data, SSR 132,502.37 and SST 143,937.29. Complete parts (a) through (c) a. Determine the coefficient of determination, r, and interpret its meaning. I (Round to four decimal places as needed.) Interpret the meaning of It means that 96 of the variation in the cost of a meal Round to two decimal places as needed.) b. Determine the standard error of the...
A researcher developed a regression model to predict the cost of a meal based on the...
 A researcher developed a regression model to predict the cost of a meal based on the summated rating (sum of ratings for food, decor, and service) and the cost per meal for 10 restaurants. The results of the study show that b, 1.5071 and S 0.1591 a. At the 0.05 level of significance, is there evidence of a linear relationship between the summated rating of a restaurant a and the cost of a S meal? b. Construct a 95% confidence...
Consider the following Price Rating Price Rating Price Rating PriceRating 58 13 14 12 19 15...
 Consider the following Price Rating Price Rating Price Rating PriceRating 58 13 14 12 19 15 58 56 59 67 14 17 41 10 54 14 21 62 14 72 12 26 20 26 48 41 17 13 30 24 13 53 51 12 21 19 69 50 78 58 21 50 83 71 25 53 47 63 81 46 12 25 49 38 24 41 19 70 31 23 26 29 79 37 36 49 58 31 25 71...
Problem 4: Variables that may affect Grades The data set contains a random sample of STAT 250 Final Exam Scores out of 80 points. For each individual sampled, the time (in hours per week) that the stu...
Problem 4: Variables that may affect Grades The data set contains a random sample of STAT 250 Final Exam Scores out of 80 points. For each individual sampled, the time (in hours per week) that the student spent participating in a GMU club or sport and working for pay outside of GMU was recorded. Values of 0 indicate the students either does not participate in a club or sport or does not work a job for pay. The goal of...
Question 7b - Conduct a Hypothesis Test to determine if there is evidence that the proportion of accounts with Good quality rating is less than 26%. Use significance level alpha=5%. Test Statistic = _...
 Question 7b - Conduct a Hypothesis Test to determine if there is
evidence that the proportion of accounts with Good quality rating
is less than 26%. Use significance level alpha=5%.
Test Statistic = _________
P value = ___________
377 1 96·33 199 2 98 72 27 98 006 014 717 002 86 997 87 3 7 4 996 7 9 le le le le rede-le Ex Ex Ex Ex Ex Ex Ex Ex ee le le le le en Ma...
Question 7b - Conduct a Hypothesis Test to determine if there is
evidence that the proportion of accounts with Good quality rating
is less than 26%. Use significance level alpha=5%.
Test Statistic = _________
P value = ___________
377 1 96·33 199 2 98 72 27 98 006 014 717 002 86 997 87 3 7 4 996 7 9 le le le le rede-le Ex Ex Ex Ex Ex Ex Ex Ex ee le le le le en Ma...
Refer to the accompanying data set and construct a 90% confidence interval estimate of the mean...
 Refer to the accompanying data set and construct a 90% confidence interval estimate of the mean pulse rate of adult females then do the same for adult males Compare the results Click the icon to view the pulse rates for adult females and adult males Construct a 90% confidence interval of the mean pulse rate for adult females Pulse Rates - X bpm bpm (Round to one decimal place as needed) Males 85 69 75 65 51 74 57 73...
 HOW DO YOU FIND B0 AND B1?
A magazine publishes restaurant ratings for various locations around the world. The magazine rates the restaurants for food, decor, service, and the cost per person. Develop a regression model to predict the cost per person, based on a variable that represents the sum of the three ratings. The magazine has compiled the accompanying table of this summated ratings variable and the cost per person for 25 restaurants in a major city. Complete parts...
HOW DO YOU FIND B0 AND B1?
A magazine publishes restaurant ratings for various locations around the world. The magazine rates the restaurants for food, decor, service, and the cost per person. Develop a regression model to predict the cost per person, based on a variable that represents the sum of the three ratings. The magazine has compiled the accompanying table of this summated ratings variable and the cost per person for 25 restaurants in a major city. Complete parts...
 A magazine publishes restaurant ratings for various locations around the world. The magazine rates the restaurants for food, decor, service, and the cost per person. Develop a regression model to predict the cost per person, based on a variable that represents the sum of the three ratings. The magazine has compiled the accompanying table of this summated ratings variable and the cost per person for 25 restaurants in a major city. Complete parts (a) through (c) below. Click the icon...
 continued table..
Will rate, thank you in advance.
A magazine publishes restaurant ratings for various locations around the world. The magazine rates the restaurants for food, decor, service, and the cost per person. Develop a regression model to predict the cost per person, based on a variable that represents the sum of the three ratings. The magazine has compiled the accompanying table of this summated ratings variable and the cost per person for 25 restaurants in a major city. Complete...
continued table..
Will rate, thank you in advance.
A magazine publishes restaurant ratings for various locations around the world. The magazine rates the restaurants for food, decor, service, and the cost per person. Develop a regression model to predict the cost per person, based on a variable that represents the sum of the three ratings. The magazine has compiled the accompanying table of this summated ratings variable and the cost per person for 25 restaurants in a major city. Complete...
 Help solve (b) please
Calibri 11 BIU Homework: Homework Chapter 13: Simple Linear Regression Save E6 fr L'a A B C D Score: 0.17 of 1 pt 1 of 5 (4 complete) HW Score: 39.09%, 1.95 of 5 p. Summated Rating costs per person 54 id 13.2.5-T تع 69 i 2 Question Help 52 61 6d 4 es 66 6 61 41 oc 40 Amagazine publishes restaurant ratings for various locations around the world. The magazine rates the restaurants for...
Help solve (b) please
Calibri 11 BIU Homework: Homework Chapter 13: Simple Linear Regression Save E6 fr L'a A B C D Score: 0.17 of 1 pt 1 of 5 (4 complete) HW Score: 39.09%, 1.95 of 5 p. Summated Rating costs per person 54 id 13.2.5-T تع 69 i 2 Question Help 52 61 6d 4 es 66 6 61 41 oc 40 Amagazine publishes restaurant ratings for various locations around the world. The magazine rates the restaurants for...
 A magazine used the summated rating of 10 restaurants to predict the cost of a restaurant meal. For that data, SSR 132,502.37 and SST 143,937.29. Complete parts (a) through (c) a. Determine the coefficient of determination, r, and interpret its meaning. I (Round to four decimal places as needed.) Interpret the meaning of It means that 96 of the variation in the cost of a meal Round to two decimal places as needed.) b. Determine the standard error of the...
 A researcher developed a regression model to predict the cost of a meal based on the summated rating (sum of ratings for food, decor, and service) and the cost per meal for 10 restaurants. The results of the study show that b, 1.5071 and S 0.1591 a. At the 0.05 level of significance, is there evidence of a linear relationship between the summated rating of a restaurant a and the cost of a S meal? b. Construct a 95% confidence...
 Consider the following Price Rating Price Rating Price Rating PriceRating 58 13 14 12 19 15 58 56 59 67 14 17 41 10 54 14 21 62 14 72 12 26 20 26 48 41 17 13 30 24 13 53 51 12 21 19 69 50 78 58 21 50 83 71 25 53 47 63 81 46 12 25 49 38 24 41 19 70 31 23 26 29 79 37 36 49 58 31 25 71...
 Question 7b - Conduct a Hypothesis Test to determine if there is
evidence that the proportion of accounts with Good quality rating
is less than 26%. Use significance level alpha=5%.
Test Statistic = _________
P value = ___________
377 1 96·33 199 2 98 72 27 98 006 014 717 002 86 997 87 3 7 4 996 7 9 le le le le rede-le Ex Ex Ex Ex Ex Ex Ex Ex ee le le le le en Ma...
Question 7b - Conduct a Hypothesis Test to determine if there is
evidence that the proportion of accounts with Good quality rating
is less than 26%. Use significance level alpha=5%.
Test Statistic = _________
P value = ___________
377 1 96·33 199 2 98 72 27 98 006 014 717 002 86 997 87 3 7 4 996 7 9 le le le le rede-le Ex Ex Ex Ex Ex Ex Ex Ex ee le le le le en Ma...
 Refer to the accompanying data set and construct a 90% confidence interval estimate of the mean pulse rate of adult females then do the same for adult males Compare the results Click the icon to view the pulse rates for adult females and adult males Construct a 90% confidence interval of the mean pulse rate for adult females Pulse Rates - X bpm bpm (Round to one decimal place as needed) Males 85 69 75 65 51 74 57 73...
Most questions answered within 3 hours.
-
A small body of mass m performs small oscillations sliding (no
rolling) along the bottom of...
asked 3 minutes ago -
The electric field in the region between two oppositely charged,
parallel, conducting plates has a magnitude...
asked 2 minutes ago -
A simple random sample was taken to test the claim that the
population mean is no...
asked 1 hour ago -
A set of length measurements are obtained with the values 165.6
± 0.3, 165.1± 0.4,166.4± 1.0,...
asked 1 hour ago -
1. Which of the following is true about unconscionable
contracts?
a. A term is substantially unconscionable...
asked 16 minutes ago -
A company is interested in estimating the costs of lunch
in their cafeteria. After surveying employees,...
asked 49 minutes ago -
A 0.2m diameter ball with an initial velocity of 8m/s rolls up a
hill without slipping....
asked 31 minutes ago -
I want to redraft the solution, using other words , use your own
words don't copy...
asked 20 minutes ago -
Hyundai Motors is considering threesites—A, B,C —at which to
locate a factory to build its new-model...
asked 22 minutes ago -
Learning Outcomes:
Upon the successful completion of this module, you should
understand the following concepts:
Strategic...
asked 23 minutes ago -
Identify four of the five major types of organizations within
the federal bureaucracy, and give examples...
asked 32 minutes ago -
The following data have been obtained
for the effect of solvent composition on the solubility of...
asked 32 minutes ago