
Homework Answers
| SSE =Syy-(Sxy)2/Sxx= | 26,822.375 | |
| s2 =SSE/(n-2)= | 8940.7916 | |
| std error σ = | =se =√s2= | 94.556 |
| std error of slope =se(β1) =s/√Sxx= | 0.1177 | |
| for 95 % CI value of t= | 3.182 | |
| margin of error E=t*std error = | 0.3747 | |
| lower bound=b1+E= | 0.462 | |
| Upper bound=b1+E= | 1.211 | |
Add Answer to:
As concrete cures, it gains strength. The following data represent the 7-day and 28-day strength in...
As concrete cures, it gains strength. The following data represent the 7-day and 28-day strength ...
 As concrete cures, it gains strength. The following data represent the 7-day and 28-day strength in pounds per square inch (psi) ofa certain type of concrete. Complete parts (a) through (f) below. 7-Dy Strength (psi)x 33802620 3390 2300 3330 4070 4850 28-Day Strength (psi,y 4190 (a) Treating the 7-day strength as the explanatory variable, use technology to determine the estimates of Po and pl P 1753.9 (Round to one decimal place as needed.) P sb9707 (Round to four decimal places...
As concrete cures, it gains strength. The following data represent the 7-day and 28-day strength in...
As concrete cures, it gains strength. The following data represent the 7-day and 28-day strength in pounds per square inch (psi) of a certain type of concrete. Complete parts (a) through (f) below. 7-Day Strength (psi), x 3340 3380 3330 2300 2480 28-Day Strength (psi), y 4630 5020 4850 4070 4120 (a) Treating the 7-day strength as the explanatory variable, x, use technology to determine the estimates of beta 0 and beta 1. beta 0almost equalsb 0equals nothing (Round to...
As concrete cures, it gains strength. The following data represent the 7-day and 28-day strength in pounds per square inch (psi) of a certain type of concrete. Complete parts (a) through (f) bel...
As concrete cures, it gains strength. The following data represent the 7-day and 28-day strength in pounds per square inch (psi) of a certain type of concrete. Complete parts (a) through (f) below. 7-Day Strength (psi), x 3340 3380 3330 2300 2480 28-Day Strength (psi), y 4630 5020 4850 4070 4120 (a) Treating the 7-day strength as the explanatory variable, x, use technology to determine the estimates of beta 0 and beta 1. beta 0almost equalsb 0equals nothing (Round to...
I need help with - What is the conclusion that can be drawn? - thank you! As concrete cures, it...
I need help with - What is the conclusion that can be drawn? - thank you! As concrete cures, it gains strength. The following data represent the 7-day and 28-day strength in pounds per square inch (psi) of a certain type of concrete. 7-Day_Strength_(psi)_-_x 28-Day_Strength_(psi)_-_y 3390 5220 3340 4630 2300 4070 2480 4120 3380 5020 (a) Treating the 7-day strength as the explanatory variable, x, use technology to determine the estimates of β0 and β1. β0≈b0= 1981.5 (Round to one...
As Concrete cures, it gains strength. The following data represent the 7-day and 28-day strength in...
 As Concrete cures, it gains strength. The following data
represent the 7-day and 28-day strength in psi of a certain type of
concrete. Conduct regression analysis for the following data and
comment on the coefficient of determination value. Calculate the
28th day strength for the concrete with seventh day strength of 4
psi
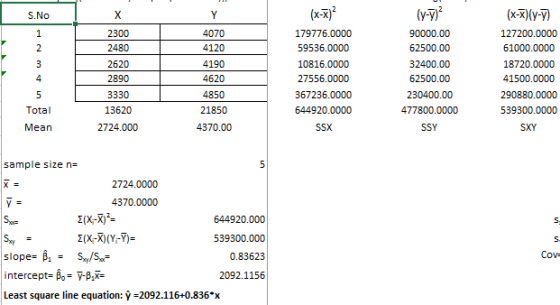
7-day 28-day strength, strength, X y 2,300 4,070 3,390 5,220 2,430 4,640 2,890 4,620 3,330 4,850 2,480 4,120 3,380 5,020 2,660 4,890 2,620 4,190 3,340 4,630
As Concrete cures, it gains strength. The following data
represent the 7-day and 28-day strength in psi of a certain type of
concrete. Conduct regression analysis for the following data and
comment on the coefficient of determination value. Calculate the
28th day strength for the concrete with seventh day strength of 4
psi
7-day 28-day strength, strength, X y 2,300 4,070 3,390 5,220 2,430 4,640 2,890 4,620 3,330 4,850 2,480 4,120 3,380 5,020 2,660 4,890 2,620 4,190 3,340 4,630
A researcher wants to determine a model to predict the 28-day strength of a concrete mixture....
 A researcher wants to determine a model to predict the 28-day strength of a concrete mixture. The following data represent the slump (a measure of concrete uniformity in inches) x1, 7-day strength (in pounds per square inch, or psi) x2, and the 28-day strength (in psi) y of a certain type of concrete. Slump measure of the uniformity of the concrete, with a higher slump indicating a less uniform mixture. Complete parts (a) through (j). 3.75 4.5 2.5 4 3...
am m on than one data point that value is the mean 3. For the data...
 am m on than one data point that value is the mean 3. For the data set shown below, complete parts (a) through (d) below x 3 4 5 7 80 y 5 7 6 13 15 (a) Find the estimates of Bo and B, Bombo (Round to three decimal places as needed.) P, by (Round to three decimal places as needed.) (b) Compute the standard error, the point estimate for a (Round to four decimal places as needed.) (c)...
The data in the accompanying table represent the rate of return of a certain company stock...
 The
data in the accompanying table represent the rate of return of a
certain company stock for 11 months, compared with the rate of
return of a certain index of 500 stocks.
Assuming the residuals are normally distributed, test whether
linear relation exist between the rate of return of the index, x,
And the rate of return for the company stock, y, at the a=0.10
level of significance.
in Month Apr-18 May-18 Jun-18 Jul-18 Aug-18 Sept-18 Oct-18 Nov-18 Dec-18 Jan-19...
The
data in the accompanying table represent the rate of return of a
certain company stock for 11 months, compared with the rate of
return of a certain index of 500 stocks.
Assuming the residuals are normally distributed, test whether
linear relation exist between the rate of return of the index, x,
And the rate of return for the company stock, y, at the a=0.10
level of significance.
in Month Apr-18 May-18 Jun-18 Jul-18 Aug-18 Sept-18 Oct-18 Nov-18 Dec-18 Jan-19...
Please solve for (a)-(d) below. The data in the accompanying table represent the rate of return...
 Please solve for (a)-(d)
below. The data in the accompanying table represent the rate of return of a certain company stock for 11 months, compared with the rate of return of a certain index of 500 stocks. Both are in percent. Complete parts (a) through Click the icon to view the data table. (a) Treating the rate of return of the index as the explanatory variable, x, use technology to determine the estimates of Bo and B1 The estimate of...
Please solve for (a)-(d)
below. The data in the accompanying table represent the rate of return of a certain company stock for 11 months, compared with the rate of return of a certain index of 500 stocks. Both are in percent. Complete parts (a) through Click the icon to view the data table. (a) Treating the rate of return of the index as the explanatory variable, x, use technology to determine the estimates of Bo and B1 The estimate of...
A pediatrician wants to determine the relation that may exist between a child's height and head...
 A pediatrician wants to determine the relation that may exist between a child's height and head circumference. She randomly selects 5 children and measures their height and head circumference. The data are summarized below. Complete parts (a) through (f) below. Height (inches), x Head Circumference (inches), y| 26.5 25.5 25 27 260 17.5 17.3 17.1 16.9 17.3 (a) Treating height as the explanatory variable, x, use technology to determine the estimates of Po and B,. Bo bo = B, b,...
 As concrete cures, it gains strength. The following data represent the 7-day and 28-day strength in pounds per square inch (psi) ofa certain type of concrete. Complete parts (a) through (f) below. 7-Dy Strength (psi)x 33802620 3390 2300 3330 4070 4850 28-Day Strength (psi,y 4190 (a) Treating the 7-day strength as the explanatory variable, use technology to determine the estimates of Po and pl P 1753.9 (Round to one decimal place as needed.) P sb9707 (Round to four decimal places...
 As Concrete cures, it gains strength. The following data
represent the 7-day and 28-day strength in psi of a certain type of
concrete. Conduct regression analysis for the following data and
comment on the coefficient of determination value. Calculate the
28th day strength for the concrete with seventh day strength of 4
psi
7-day 28-day strength, strength, X y 2,300 4,070 3,390 5,220 2,430 4,640 2,890 4,620 3,330 4,850 2,480 4,120 3,380 5,020 2,660 4,890 2,620 4,190 3,340 4,630
As Concrete cures, it gains strength. The following data
represent the 7-day and 28-day strength in psi of a certain type of
concrete. Conduct regression analysis for the following data and
comment on the coefficient of determination value. Calculate the
28th day strength for the concrete with seventh day strength of 4
psi
7-day 28-day strength, strength, X y 2,300 4,070 3,390 5,220 2,430 4,640 2,890 4,620 3,330 4,850 2,480 4,120 3,380 5,020 2,660 4,890 2,620 4,190 3,340 4,630
 A researcher wants to determine a model to predict the 28-day strength of a concrete mixture. The following data represent the slump (a measure of concrete uniformity in inches) x1, 7-day strength (in pounds per square inch, or psi) x2, and the 28-day strength (in psi) y of a certain type of concrete. Slump measure of the uniformity of the concrete, with a higher slump indicating a less uniform mixture. Complete parts (a) through (j). 3.75 4.5 2.5 4 3...
 am m on than one data point that value is the mean 3. For the data set shown below, complete parts (a) through (d) below x 3 4 5 7 80 y 5 7 6 13 15 (a) Find the estimates of Bo and B, Bombo (Round to three decimal places as needed.) P, by (Round to three decimal places as needed.) (b) Compute the standard error, the point estimate for a (Round to four decimal places as needed.) (c)...
 The
data in the accompanying table represent the rate of return of a
certain company stock for 11 months, compared with the rate of
return of a certain index of 500 stocks.
Assuming the residuals are normally distributed, test whether
linear relation exist between the rate of return of the index, x,
And the rate of return for the company stock, y, at the a=0.10
level of significance.
in Month Apr-18 May-18 Jun-18 Jul-18 Aug-18 Sept-18 Oct-18 Nov-18 Dec-18 Jan-19...
The
data in the accompanying table represent the rate of return of a
certain company stock for 11 months, compared with the rate of
return of a certain index of 500 stocks.
Assuming the residuals are normally distributed, test whether
linear relation exist between the rate of return of the index, x,
And the rate of return for the company stock, y, at the a=0.10
level of significance.
in Month Apr-18 May-18 Jun-18 Jul-18 Aug-18 Sept-18 Oct-18 Nov-18 Dec-18 Jan-19...
 Please solve for (a)-(d)
below. The data in the accompanying table represent the rate of return of a certain company stock for 11 months, compared with the rate of return of a certain index of 500 stocks. Both are in percent. Complete parts (a) through Click the icon to view the data table. (a) Treating the rate of return of the index as the explanatory variable, x, use technology to determine the estimates of Bo and B1 The estimate of...
Please solve for (a)-(d)
below. The data in the accompanying table represent the rate of return of a certain company stock for 11 months, compared with the rate of return of a certain index of 500 stocks. Both are in percent. Complete parts (a) through Click the icon to view the data table. (a) Treating the rate of return of the index as the explanatory variable, x, use technology to determine the estimates of Bo and B1 The estimate of...
 A pediatrician wants to determine the relation that may exist between a child's height and head circumference. She randomly selects 5 children and measures their height and head circumference. The data are summarized below. Complete parts (a) through (f) below. Height (inches), x Head Circumference (inches), y| 26.5 25.5 25 27 260 17.5 17.3 17.1 16.9 17.3 (a) Treating height as the explanatory variable, x, use technology to determine the estimates of Po and B,. Bo bo = B, b,...
Most questions answered within 3 hours.
-
Which expression computes a pseudorandom integer between -10 and
10 using rand()
from cstdlib?
A. (rand(...
asked 1 minute from now -
Roybus, Inc., a manufacturer of flash memory, just reported that
its main production facility in Taiwan...
asked 6 minutes ago -
Two capacitors connected in parallel produce an equivalent
capacitance of 45.0 μF but when connected in...
asked 15 minutes ago -
The differences between the two sets of dependent data are -1,
2,-,2, 2. Round to the...
asked 32 minutes ago -
A χ2-curve, looking at the relationship between age and hours
spent working at an office per...
asked 1 hour ago -
The pH of a sample of water from a river is 5.0. A
sample of effluent from...
asked 1 hour ago -
At the beginning of the period, the Fabricating Department
budgeted direct labor of $136,500 and equipment...
asked 2 hours ago -
Please answer all
____ 28. Rent control is usually
justified on the grounds that it protects...
asked 2 hours ago -
PARTS A-D HAVE BEEN ANSWERED. WAS TOLD TO REPOST. ONLY ANSWER
PARTS E and F.
A...
asked 2 hours ago -
2) You are given the task of finding a representation for a
circle in a drawing...
asked 3 hours ago -
STUDY QUESTION: Does use of diet drug fen-phen
(fenfluramine-phentermine) cause valvular heart disease?
HINT: Valvular heart...
asked 3 hours ago -
1. An object weighing 40 N rests on a surface. The coefficient
of friction is 0.35....
asked 4 hours ago