question asking for moving average .. i used the data analysis tool in excel it gives me the right answer but with wrong in sequence
The normal Fourmal says = Sum of 3 months / 3 = F for the 4th month
But in data analysis tool it comes in forecast of the 3rd month
please let me know why it does not come in the right sequence
and how to solve this issue 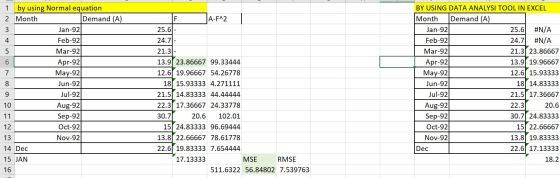
Homework Answers
Go to Moving Averages.

Select the range as below.

The output is:
Add Answer to:
question asking for moving average .. i used the data analysis
tool in excel it gives...
Moving average (MA) Calculate the sales using 2, 3, 4, 5, and 6 month moving average...
Moving average (MA) Calculate the sales using 2, 3, 4, 5, and 6 month moving average values. Forecast and plot the upcoming period’s sales using the moving average series that fits best. Explain why you chose that particular MA. Why is it inadvisable to use the Moving Average approach to forecast far into the future? Month Sale Month Sale Month Sale Oct-12 13.30 Oct-13 24.01 Oct-14 50.56 Nov-12 1.70 Nov-13 32.67 Nov-14 60.06 Dec-12 11.44 Dec-13 23.19 Dec-14 61.73 Jan-13...
Given the following history, use a three-quarter moving average to forecast the demand for the third...
Given the following history, use a three-quarter moving average to forecast the demand for the third quarter of this year. Note, the 1st quarter is Jan, Feb, and Mar; 2nd quarter Apr, May, Jun; 3rd quarter Jul, Aug, Sep; and 4th quarter Oct, Nov, Dec. JAN FEB MAR APR MAY JUN JUL AUG SEP OCT NOV DEC Last year 170 200 210 240 250 270 225 215 215 275 280 300 This year 205 210 140 255 245 220 Forecast...
If there are any seasonality or relationship between the price and the US oil price? How...
If there are any seasonality or relationship between the price and the US oil price? How to analyze? Jan-10 2.769 Jan-11 3.148 Jan-12 3.44 Jan-13 3.391 Jan-14 3.392 Feb-10 2.699 Feb-11 3.264 Feb-12 3.64 Feb-13 3.736 Feb-14 3.434 Mar-10 2.824 Mar-11 3.615 Mar-12 3.907 Mar-13 3.779 Mar-14 3.606 Apr-10 2.9 Apr-11 3.852 Apr-12 3.958 Apr-13 3.638 Apr-14 3.735 May-10 2.89 May-11 3.96 May-12 3.791 May-13 3.675 May-14 3.75 Jun-10 2.785 Jun-11 3.735 Jun-12 3.596 Jun-13 3.689 Jun-14 3.766 Jul-10 2.782...
calculate the monthly time-weighted and money weighted returns for shareholders in the ADKSX with using excel....
calculate the monthly time-weighted and money weighted returns for shareholders in the ADKSX with using excel. In a text box nearby, comment on whether investors’ trading decisions have created value. Month ADKSX Return (%) ADKSX Cash Flow ($) Nov-09 3.49 -$10,648,393 Dec-09 6.93 -$618,800 Jan-10 -2.05 $940,820 Feb-10 5.74 -$2,484,437 Mar-10 5.19 -$3,699,836 Apr-10 5.48 -$1,379,757 May-10 -4.68 $2,145,936 Jun-10 -6.31 -$2,953,884 Jul-10 5.9 -$4,160,472 Aug-10 -5.18 $1,096,304 Sep-10 8.61 -$5,571,657 Oct-10 4.5 -$669,464 Nov-10 2.77 -$3,145,367 Dec-10 9.16 -$6,162,018...
1)Given the data in the table, calculate the four period moving average forecast for unemployment...
1)Given the data in the table, calculate the four period moving average forecast for unemployment rate for October 2011. Express your result in percent, without the percent sign (e.g., 7.3 for 7.3%). Unemployment Year Month Rate (%) 2010 Oct 6.8 Nov 7.0 Dec 7.5 2011 Jan 8.0 Feb 8.2 Mar 8.5 Apr 8.6 May 8.6 Jun 8.9 Jul 9.1 Aug 8.8 Sep 8.7 Oct
The human resources department needs to forecast the number of employees at a site. The data...
 The human resources department needs to forecast the number of employees at a site. The data for several months is supplied below. Be careful since the data is listed beginning with the most recent. The forecasting method to be used here is the 7 month moving average. Please round your forecast to the nearest whole number Nov 2019: 956 Oct 2019: 1014 Sep 2019: 1009 Aug 2019: 963 Jul 2019: 966 Jun 2019: 1024 May 2019: 1045||Apr 2019: 1047 Mar...
Consider five years of monthly sales data for a company in the attached file (Q5.xlsx). a) Foreca...
 Consider five years of monthly sales data for a company in the
attached file (Q5.xlsx). a) Forecast monthly sales for the next
year (2020). (10 marks) b) Discuss whether a simple exponential
smoothing model works well with this data or not. (5 m
7 9 Month Sales 747 Feb-14 697 Mar-14 1014 Jan-14 Ap4 1126 May-14 1105 Jun-14 1450 Jul-14 1633 Aug-14 1711 Sep-14 1307 Oct-1223 Nov-14 9T5 Dec-14S53 4J-15 1024 Feb-15928 Mar-151442 7Apr-151371 May-15 1536 Ju15 2004 Jul-15 1854...
Consider five years of monthly sales data for a company in the
attached file (Q5.xlsx). a) Forecast monthly sales for the next
year (2020). (10 marks) b) Discuss whether a simple exponential
smoothing model works well with this data or not. (5 m
7 9 Month Sales 747 Feb-14 697 Mar-14 1014 Jan-14 Ap4 1126 May-14 1105 Jun-14 1450 Jul-14 1633 Aug-14 1711 Sep-14 1307 Oct-1223 Nov-14 9T5 Dec-14S53 4J-15 1024 Feb-15928 Mar-151442 7Apr-151371 May-15 1536 Ju15 2004 Jul-15 1854...
Calculate the sample correlation coefficient rxy. Calculate the value of the test statistic. Date Energy Healthcare...
Calculate the sample correlation coefficient rxy. Calculate the value of the test statistic. Date Energy Healthcare Jan-10 -4.87 -0.15 Feb-10 1.8 0.53 Mar-10 2.26 1.41 Apr-10 3.03 -3.75 May-10 -11.5 -5.12 Jun-10 -5.67 -0.52 Jul-10 8.73 1.49 Aug-10 -5.99 -0.97 Sep-10 10.15 8.24 Oct-10 3.89 2.28 Nov-10 2.85 -2.52 Dec-10 5.55 1.4 Jan-11 6.6 1.55 Feb-11 5.7 3.04 Mar-11 1.32 1.22 Apr-11 1.64 5.89 May-11 -4.06 2.62 Jun-11 -2.08 -0.55 Jul-11 1.14 -2.64 Aug-11 -10.41 -2.8 Sep-11 -15.06 -4.17 Oct-11...
Use the data table to estimate the alpha of Nike and HP Inc. stock, expressed as...
Use the data table to estimate the alpha of Nike and HP Inc. stock, expressed as % per month. Monthly Returns Date Nike HP Inc. S&P 500 Jan-11 -3.442% 8.527% 2.330% Feb-11 7.941% -4.509% 3.474% Mar-11 -14.624% -5.913% -0.005% Apr-11 8.745% -1.465% 2.896% May-11 2.587% -7.406% -1.121% Jun-11 6.915% -2.301% -1.706% Jul-11 0.189% -3.379% -2.000% Aug-11 -3.882% -25.988% -5.498% Sep-11 -0.958% -13.292% -6.910% Oct-11 12.677% 18.530% 10.915% Nov-11 -0.176% 5.036% -0.406% Dec-11 0.572% -7.406% 1.024% Jan-12 7.907% 8.618% 4.637% Feb-12...
Question 3: The following table shows the monthly minimum temperature (degree Celsius (C)) of a city in Australia for 3 consequent years Mean of Minimum Temperature 20102011 2012 18 15.5 12.9 12.5 10...
 Question 3: The following table shows the monthly minimum temperature (degree Celsius (C)) of a city in Australia for 3 consequent years Mean of Minimum Temperature 20102011 2012 18 15.5 12.9 12.5 10 Month Jan Feb Mar 15.6 17.7 17.7 13.5 12.3 9.5 7.3 7.6 7.2 10.1 10 11.9 13.7 16 14.5 11.8 9.8 7.9 Jun Jul Aug Sep Oct Nov Dec 6.4 7.6 8.7 7.8 9.2 10.6 12.6 14.1 12.2 13.9 1. Propose a visualisation method to compare the...
 The human resources department needs to forecast the number of employees at a site. The data for several months is supplied below. Be careful since the data is listed beginning with the most recent. The forecasting method to be used here is the 7 month moving average. Please round your forecast to the nearest whole number Nov 2019: 956 Oct 2019: 1014 Sep 2019: 1009 Aug 2019: 963 Jul 2019: 966 Jun 2019: 1024 May 2019: 1045||Apr 2019: 1047 Mar...
 Consider five years of monthly sales data for a company in the
attached file (Q5.xlsx). a) Forecast monthly sales for the next
year (2020). (10 marks) b) Discuss whether a simple exponential
smoothing model works well with this data or not. (5 m
7 9 Month Sales 747 Feb-14 697 Mar-14 1014 Jan-14 Ap4 1126 May-14 1105 Jun-14 1450 Jul-14 1633 Aug-14 1711 Sep-14 1307 Oct-1223 Nov-14 9T5 Dec-14S53 4J-15 1024 Feb-15928 Mar-151442 7Apr-151371 May-15 1536 Ju15 2004 Jul-15 1854...
Consider five years of monthly sales data for a company in the
attached file (Q5.xlsx). a) Forecast monthly sales for the next
year (2020). (10 marks) b) Discuss whether a simple exponential
smoothing model works well with this data or not. (5 m
7 9 Month Sales 747 Feb-14 697 Mar-14 1014 Jan-14 Ap4 1126 May-14 1105 Jun-14 1450 Jul-14 1633 Aug-14 1711 Sep-14 1307 Oct-1223 Nov-14 9T5 Dec-14S53 4J-15 1024 Feb-15928 Mar-151442 7Apr-151371 May-15 1536 Ju15 2004 Jul-15 1854...
 Question 3: The following table shows the monthly minimum temperature (degree Celsius (C)) of a city in Australia for 3 consequent years Mean of Minimum Temperature 20102011 2012 18 15.5 12.9 12.5 10 Month Jan Feb Mar 15.6 17.7 17.7 13.5 12.3 9.5 7.3 7.6 7.2 10.1 10 11.9 13.7 16 14.5 11.8 9.8 7.9 Jun Jul Aug Sep Oct Nov Dec 6.4 7.6 8.7 7.8 9.2 10.6 12.6 14.1 12.2 13.9 1. Propose a visualisation method to compare the...
Most questions answered within 3 hours.
-
For the reaction CaI2+2AgNO3⟶2AgI+Ca(NO3)2 how many grams of
silver iodide, AgI, are produced from 56.5 g...
asked 5 minutes ago -
Write an equation for hydrolysis via acid catalysis.
Using ethyl acetate, ethyl benzoate, ethyl formate or...
asked 13 minutes ago -
Only one graph is needed.
(a) Draw a Supply Curve and the Demand Curve for the...
asked 16 minutes ago -
Fill in the blanks and please show how you arrived at numerical
answers
. The...
asked 16 minutes ago -
91. If the half – life of a sample of radioactive
material is 60 days, what...
asked 23 minutes ago -
White light (380nm-750nm) strikes a diffraction grating (420
lines/mm) at normal incidence. What is the highest-order...
asked 33 minutes ago -
1) Explain what is meant by a good being "excludable."?
2) Explain what is meant by...
asked 32 minutes ago -
I need help with this question:
Describe in detail at least two factors that stimulated American...
asked 39 minutes ago -
Calculate the Boyle temperature for helium assuming it follows
the Berthelot equation of state.
asked 40 minutes ago -
Summarize Strategic Corporate Social Responsibility, 4th edition
2017 book, chapter one and two.
asked 40 minutes ago -
1. If the standard deviations for return on stock A and stock B
are 28% and...
asked 55 minutes ago -
Please use python to explain.
Assume that the variables x and
y refer to strings. Write...
asked 1 hour ago