1. Use the Keynesian cross model and show graphically in which direction will equilibrium level of...
1. Use the Keynesian cross model and show graphically in which direction will equilibrium level of income (or output) change. For each of the following, write down the formula for the size of the change of income (i.e. write down the formula for ∆Y):
(i) An increase in government purchases
(ii) An increase in taxes
(iii) An increase in government purchase and an increase in taxes of equal amount
(Nb: You must draw a SEPARATE graph for parts (i) and (ii). Part (iii) does not need any graph so only provide explanation).
2. In the Keynesian cross model, assume the consumption function is given by the following: C = 120 +0.8(Y-T)
Planned Investment is 200, planned government purchases and taxes are each 400.
(i) After substituting for C, I, G and T, write down the equation for Planned Expenditure PE.
(ii) According to the consumption function C above, what is the value of MPC?
(iii) Calculate government purchase multiplier.
3. The following equations describes an economy:
Y = C + I + G
C = 50 +0.75 (Y – T)
I =150 – 10r
(M/P)d = Y – 50r
G = 250
T = 200
M = 3000
P = 4
a) From the above list, use the relevant equations to derive the equation for IS curve. (Hint: Substitute C, I and G in to Y to find your answer)
b) From the above list, use the relevant set of equations to derive the LM curve.
c) Using your IS and LM curve equations from parts a and b, derive what is equilibrium level of Y and equilibrium interest rate (r)? (Hint: To solve this question, set the IS equation equal to LM equation and find equilibrium r first. Then substitute this equilibrium r in to either IS or LM equation to find equilibrium Y)
4) Suppose the Fed increases the money supply by 5%. Assume the velocity of money is constant.
a) What happens to AD curve?
b) Draw a graph starting from LR equilibrium as shown in class and show what happens to price and output in the short run.
c) Based on your answer to part b, draw another graph to show how we can return to LR equilibrium from the SR equilibrium point. You must also explain briefly your answer. (Hint: You need to explain what happens to unemployment in short run due to change in AD and consequently, what happens to wages and therefore price level P. Thus, explain how changes in production and employment can take us back to LR equilibrium).
Homework Answers
(1)
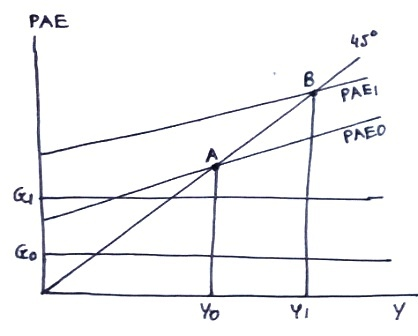
In each of the following graphs, planned aggregate expenditure (PAE) and real GDP (Y) are measured vertically and horizontally respectively. C0, I0, G0 and PAE0 are initial consumption, investment, government spending and planned aggregate expenditure curves (where PAE0 = C0 + I0 + G0). Initial equilibrium is at point A where PAE0 intersects 450 line with initial real GDP Y0.
Marginal propensity to consume (MPC) = c.
(a) Spending multiplier = 1 / (1 - c)
An increase in government spending from G0 to G1 will increase PAE, shifting PAE0 upward to PAE1. New equilibrium is at point B where PAE1 intersects 450 line with higher real GDP Y1.
 Y = Y1 - Y0 = [1 / (1 - c)] x G
(b) Tax multiplier = -c / (1 - c)
An increase in tax will decrease disposable income, lowering consumption from C0 to C1 which will decrease PAE, shifting PAE0 downward to PAE1. New equilibrium is at point B where PAE1 intersects 450 line with lower real GDP Y1.
Y = Y1 - Y0 = [-c / (1 - c)] x T

(c) In this case, G = T
When G is increased by G,
Yg = [1 / (1 - c)] x G
When T is increased by T,
Yt = [-c / (1 - c)] x T
Net change in Y = Yg + Yt = [1 / (1 - c)] x G - [c / (1 - c)] x T = [(1 - c) / (1 - c)] x G = G = T
Add Answer to:
1. Use the Keynesian cross model and show graphically in which
direction will equilibrium level of...
Question 1. Consider a closed economy to which the Keynesian-cross analysis applies. Consumption is given by...
 Question 1. Consider a closed economy to which the Keynesian-cross analysis applies. Consumption is given by the equation C= 200 + 2/3(Y-T). Planned investment is 300, as are government spending and taxes. (18 points) a. If Y is 1,500, what is planned spending? Should equilibrium Y be higher or lower than 1,500? (4 points) b. What is equilibrium Y? (Hint: Substitute the values of equations for planned consumption, investment, and government spending into the equation Y C+I+ G and then...
a) Using the Keynesian cross model where the goods market equilibrium is determined and analyzed, graphically...
a) Using the Keynesian cross model where the goods market equilibrium is determined and analyzed, graphically derive the IS curve, and explain each step. Explain what the equilibrium in the goods market implies for the IS curve, i.e., why is the IS curve downward sloping. Also, explain what causes shifts in the IS curve b) First, based on the analysis of the financial market equilibrium, graphically derive the LM curve. Explain what the LM curve is and explain in detail...
Question 2 In the Keynesian cross, assume that the consumption function is given by C =...
 Question 2 In the Keynesian cross, assume that the consumption function is given by C = 150 +0.7 (Y-T) Planned investment is: I = 100 – 10 *r Government purchases and taxes are both 50. a. Graph consumption as function of income. b. Graph investment as function of the real interest rate. c. Suppose that the real interest rate is 5. Write the equation of the planned expenditure. d. Suppose that the real interest rate is 5. What is the...
1. Use a graph of the Keynesian cross to show the effects of an increase in...
1. Use a graph of the Keynesian cross to show the effects of an increase in exogenous planned investment on the equilibrium level of income/output. Be sure to label: i. the axes; ii. the curves; iii. the initial equilibrium values; iv. the direction the curve shifts; and v. the terminal equilibrium values.
Use a graph of the Keynesian cross to show the effects of an increase in exogenous...
Use a graph of the Keynesian cross to show the effects of an increase in exogenous planned investment on the equilibrium level of income/output. Be sure to label: i. the axes; ii. the curves; iii. the initial equilibrium values; iv. the direction the curve shifts; and v. the terminal equilibrium values.
4. Keynesian cross and Keynesian multiplier: In the Keynesian cross, assume that the consumption function is...
 4. Keynesian cross and Keynesian multiplier: In the Keynesian cross, assume that the consumption function is given by C - 100 +0.5 (Y-T) Planned investment is 75; government purchases and taxes are both 100. a) Graph planned expenditure as a function of income. b) What is the equilibrium level of income? c) If government purchases increase to 110, what is the new equilibrium income? d) How big is the Keynesian government purchases multiplier in this example? e) What level of...
please answer part h to part k Question 2 In the Keynesian cross, assume that the consumption function is given by C = 1...
 please answer part h to part
k
Question 2 In the Keynesian cross, assume that the consumption function is given by C = 150 +0.7 (Y-T) Planned investment is: I = 100 - 10 *r Government purchases and taxes are both 50. a. Graph consumption as function of income. b.Graph investment as function of the real interest rate. c.Suppose that the real interest rate is 5. Write the equation of the planned expenditure. d.Suppose that the real interest rate is...
please answer part h to part
k
Question 2 In the Keynesian cross, assume that the consumption function is given by C = 150 +0.7 (Y-T) Planned investment is: I = 100 - 10 *r Government purchases and taxes are both 50. a. Graph consumption as function of income. b.Graph investment as function of the real interest rate. c.Suppose that the real interest rate is 5. Write the equation of the planned expenditure. d.Suppose that the real interest rate is...
Just e) f) and g) if possible please Question 5: The IS-LM model Consider the following...
 Just e) f) and g) if possible please
Question 5: The IS-LM model Consider the following IS-LM model: Consumption: C = 200 +0.25YD Investment: I=150 + 0.25Y - 10001 Government spending: G=250 Taxes: T=200 Money demand: L(i,Y)-2Y - 8000 Money supply: Ms /P=1600 (a) Derive the equation for the IS curve. (Hint: You want an equation with Y on the lefthand side and all else on the right) (b) Derive the equation for the LM curve. (Hint: It will be...
Just e) f) and g) if possible please
Question 5: The IS-LM model Consider the following IS-LM model: Consumption: C = 200 +0.25YD Investment: I=150 + 0.25Y - 10001 Government spending: G=250 Taxes: T=200 Money demand: L(i,Y)-2Y - 8000 Money supply: Ms /P=1600 (a) Derive the equation for the IS curve. (Hint: You want an equation with Y on the lefthand side and all else on the right) (b) Derive the equation for the LM curve. (Hint: It will be...
Question 2 In the Keynesian cross, assume that the consumption function is given by C = 150 +0.7 (Y-T) Planned inve...
 Question 2 In the Keynesian cross, assume that the consumption function is given by C = 150 +0.7 (Y-T) Planned investment is: I = 100 - 10 *r Government purchases and taxes are both 50. a. Graph consumption as function of income. b.Graph investment as function of the real interest rate. c.Suppose that the real interest rate is 5. Write the equation of the planned expenditure. d.Suppose that the real interest rate is 5. What is the equilibrium level of...
Use the diagram of the Keynesian cross or loanable funds model to show how an increase...
Use the diagram of the Keynesian cross or loanable funds model to show how an increase in taxes shifts the IS curve. Be sure to label: i. the axes; ii. the curves; iii. the initial equilibrium values; iv. the direction the curve shifts; and v. the terminal equilibrium values
 Question 1. Consider a closed economy to which the Keynesian-cross analysis applies. Consumption is given by the equation C= 200 + 2/3(Y-T). Planned investment is 300, as are government spending and taxes. (18 points) a. If Y is 1,500, what is planned spending? Should equilibrium Y be higher or lower than 1,500? (4 points) b. What is equilibrium Y? (Hint: Substitute the values of equations for planned consumption, investment, and government spending into the equation Y C+I+ G and then...
 Question 2 In the Keynesian cross, assume that the consumption function is given by C = 150 +0.7 (Y-T) Planned investment is: I = 100 – 10 *r Government purchases and taxes are both 50. a. Graph consumption as function of income. b. Graph investment as function of the real interest rate. c. Suppose that the real interest rate is 5. Write the equation of the planned expenditure. d. Suppose that the real interest rate is 5. What is the...
 4. Keynesian cross and Keynesian multiplier: In the Keynesian cross, assume that the consumption function is given by C - 100 +0.5 (Y-T) Planned investment is 75; government purchases and taxes are both 100. a) Graph planned expenditure as a function of income. b) What is the equilibrium level of income? c) If government purchases increase to 110, what is the new equilibrium income? d) How big is the Keynesian government purchases multiplier in this example? e) What level of...
 please answer part h to part
k
Question 2 In the Keynesian cross, assume that the consumption function is given by C = 150 +0.7 (Y-T) Planned investment is: I = 100 - 10 *r Government purchases and taxes are both 50. a. Graph consumption as function of income. b.Graph investment as function of the real interest rate. c.Suppose that the real interest rate is 5. Write the equation of the planned expenditure. d.Suppose that the real interest rate is...
please answer part h to part
k
Question 2 In the Keynesian cross, assume that the consumption function is given by C = 150 +0.7 (Y-T) Planned investment is: I = 100 - 10 *r Government purchases and taxes are both 50. a. Graph consumption as function of income. b.Graph investment as function of the real interest rate. c.Suppose that the real interest rate is 5. Write the equation of the planned expenditure. d.Suppose that the real interest rate is...
 Just e) f) and g) if possible please
Question 5: The IS-LM model Consider the following IS-LM model: Consumption: C = 200 +0.25YD Investment: I=150 + 0.25Y - 10001 Government spending: G=250 Taxes: T=200 Money demand: L(i,Y)-2Y - 8000 Money supply: Ms /P=1600 (a) Derive the equation for the IS curve. (Hint: You want an equation with Y on the lefthand side and all else on the right) (b) Derive the equation for the LM curve. (Hint: It will be...
Just e) f) and g) if possible please
Question 5: The IS-LM model Consider the following IS-LM model: Consumption: C = 200 +0.25YD Investment: I=150 + 0.25Y - 10001 Government spending: G=250 Taxes: T=200 Money demand: L(i,Y)-2Y - 8000 Money supply: Ms /P=1600 (a) Derive the equation for the IS curve. (Hint: You want an equation with Y on the lefthand side and all else on the right) (b) Derive the equation for the LM curve. (Hint: It will be...
 Question 2 In the Keynesian cross, assume that the consumption function is given by C = 150 +0.7 (Y-T) Planned investment is: I = 100 - 10 *r Government purchases and taxes are both 50. a. Graph consumption as function of income. b.Graph investment as function of the real interest rate. c.Suppose that the real interest rate is 5. Write the equation of the planned expenditure. d.Suppose that the real interest rate is 5. What is the equilibrium level of...
Most questions answered within 3 hours.
-
The mayor of a small town estimates that 33% of the
residents in the town favor...
asked 44 minutes ago -
1. True or false: According to the Gordon Growth Model, firms
that pay dividends will always...
asked 1 hour ago -
20
Lansing Corporation reported net income of $67 million for last
year. Depreciation expense totaled $15...
asked 1 hour ago -
Write a MATLAB userdefined function that calculates the product and
the ratio of two variables x...
asked 1 hour ago -
Timia needs some cash in a hurry. She owns her car outright and
is considering a...
asked 1 hour ago -
A sweepstakes posted the probabilities of winning each prize and
the prize amounts as shown in...
asked 1 hour ago -
Synthesis of fructose-2,6-bisphosphate is catalyzed by a
bifunctional enzyme that contains two catalytic domains: PFK2
(kinase...
asked 1 hour ago -
observation
initial burst volume
total volume titrated to reach end point
what happened to the rise...
asked 2 hours ago -
Let x1, x2,x3,and x4 be a random sample from
population with normal distribution with mean ?...
asked 2 hours ago -
A string of mass m and length L is under tension T. The speed of
a...
asked 2 hours ago -
Look at the descriptions of high sensation seekers in your book.
They look like they would...
asked 2 hours ago -
Write a method called is1to1 that accepts a map whose keys and
values are strings as...
asked 2 hours ago