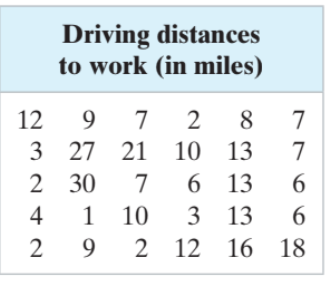
The driving distances (in miles) to work of 30 people are shown in the table at the left. Assume the population standard deviation is 8 miles. Find (a) the point estimate of the population mean m and (b) the margin of error for a 95% confidence interval. only use four rows of data
Homework Answers
Answer
(A) Point estimate of mean of population is equal to 
= (sum of all
data values in first four rows)/(total number of data values in
first four rows)
this implies
=(12+9+7+2+8+7+3+27+21+10+13+7+2+30+7+6+13+6+4+1+10+3+13+6)/24
= 227/24
= 9.46 (rounded to 2 decimal places)
(B) Population standard deviation 
Margin of error ME = 
where z = 1.96 for 95% confidence interval (using z distribution table)
n = 24 (sample size for first four rows)
and
(population standard deviation)
this implies
ME = 

 (rounded to 2
decimals)
(rounded to 2
decimals)
Add Answer to:
The driving distances (in miles) to work of 30 people are shown
in the table at...
The driving distances (in miles) to work of 30 people are shown below. Assume the population...
 The driving distances (in miles) to work of 30 people
are shown below. Assume the population standard deviation is 8
miles.
Construct a 95% confidence interval
12 9 7 2 8 7 3 27 21 10 13 7 2 307 6 13 6 4 1 10 3 13 6 2 9 2 12 16 18 Contuoto00onfidence interval c
The driving distances (in miles) to work of 30 people
are shown below. Assume the population standard deviation is 8
miles.
Construct a 95% confidence interval
12 9 7 2 8 7 3 27 21 10 13 7 2 307 6 13 6 4 1 10 3 13 6 2 9 2 12 16 18 Contuoto00onfidence interval c
In a random sample of 11 people, the mean driving distance to work was 25.2 miles...
In a random sample of 11 people, the mean driving distance to work was 25.2 miles and the standard deviation was 7.3 miles. Assume the population is normally distributed and use the t-distribution to find the margin of error and construct a 95% confidence interval for the population mean. Identify margin of error Construct a 95% confidence interval for the population mean (___,___)
In a random sample of ten people, the mean driving distance to work was 18.6 miles...
 In a random sample of ten people, the mean driving distance to work was 18.6 miles and the standard deviation was 6.5 miles. Assume the population is normally distributed and use the t-distribution to find the margin of error and construct a 90% confidence interval for the population mean . Interpret the results. Identify the margin of error. (Round to one decimal place as needed.) Construct a 90% confidence interval for the population mean (Round to one decimal place as...
In a random sample of twelve people, the mean driving distance to work was 20.8 miles...
In a random sample of twelve people, the mean driving distance to work was 20.8 miles and the standard deviation was 5.4 miles. Assume the population is normally distributed and use thet-distribution to find the margin of error and construct a 99% confidence interval for the population mean mu. Interpret the results. Identify the margin of error.
idenitfy the margin of error( round to one decimal place) is it square miles? miles? miles...
 idenitfy the margin of error( round to one decimal place) is
it square miles? miles? miles ler hour?
construct a 90% confidence interval for the population
mean?
interpret
of 14 10 complete HW Score: 41.84, 5.86 of 14 Score: 0 of 1 pt X 6.2.18-T Question in a random sample of twee people, the mean driving dance to work was 24.1. 90% confidence interval for the population mean Interpret the results and the sandard deviation was 75 miles. Assume the...
idenitfy the margin of error( round to one decimal place) is
it square miles? miles? miles ler hour?
construct a 90% confidence interval for the population
mean?
interpret
of 14 10 complete HW Score: 41.84, 5.86 of 14 Score: 0 of 1 pt X 6.2.18-T Question in a random sample of twee people, the mean driving dance to work was 24.1. 90% confidence interval for the population mean Interpret the results and the sandard deviation was 75 miles. Assume the...
what is the margin of error and the confidence interval? Question Help In a random sample...
 what is the margin of error and the confidence interval?
Question Help In a random sample of seven people, the mean driving distance to work was 24.7 miles and the standard deviation was 6.6 miles. Assuming the population is normally distributed and using the I-distribution, a 90% confidence interval for the population mean is (15.5, 33.9) (and the margin of error is 9.2). Through research, it has been found that the population standard deviation of driving distances to work is...
what is the margin of error and the confidence interval?
Question Help In a random sample of seven people, the mean driving distance to work was 24.7 miles and the standard deviation was 6.6 miles. Assuming the population is normally distributed and using the I-distribution, a 90% confidence interval for the population mean is (15.5, 33.9) (and the margin of error is 9.2). Through research, it has been found that the population standard deviation of driving distances to work is...
Driver’s License Rates. Fewer young people are driving. In 1995, 63.9% of people under 20 years...
Driver’s License Rates. Fewer young people are driving. In 1995, 63.9% of people under 20 years old who were eligible had a driver’s license. Bloomberg reported that percentage had dropped to 41.7% in 2016. Suppose these results are based on a random sample of 1200 people under 20 years old who were eligible to have a driver’s license in 1995 and again in 2016. a. At 95% confidence, what is the margin of error and the interval estimate of the...
{Exercise 8.41} Fewer young people are driving. In 1983, 87 percent of 19 year-olds had a...
 {Exercise 8.41} Fewer young people are driving. In 1983, 87 percent of 19 year-olds had a driver's license. Twenty-five years later that percentage had dropped to 75 percent (University of Michigan Transportation Research Institute website, April 7, 2012). Suppose these results are based on a random sample of 1,650 nineteen year-olds in 1983 and again in 2008. a. At 95% confidence, what is the margin of error and the interval estimate of the number of nineteen year old drivers in...
41. W Fewer young people are driving. In 1983, 87% of 19-year-olds had a driver's license....
 41. W Fewer young people are driving. In 1983, 87% of 19-year-olds had a driver's license. Twenty-five years later that percentage had dropped to 75% (University of Michigan Transportation Research Institute website, April 7, 2012). Suppose these results are based on a random sample of 1200 19-year-olds in 1983 and again in 2008. a. At 95% confidence, what is the margin of error and the interval estimate of the number of 19-year-old drivers in 1983? b. At 95% confidence, what...
EXerCIse 8.417. Fewer young people are driving. In 1983, 87 percent of 19 year-olds had a...
 EXerCIse 8.417. Fewer young people are driving. In 1983, 87 percent of 19 year-olds had a driver's license. Twenty-five years later that percentage had dropped to 75 percent (University of Michigan Transportation Research Institute website, April 7, 2012). Suppose these results are based on a random sample of 1,150 nineteen year-olds in 1983 and again in 2008. a. At 95% confidence, what is the marqin of error and the interval estimate of the number of nineteen year old drivers in...
 The driving distances (in miles) to work of 30 people
are shown below. Assume the population standard deviation is 8
miles.
Construct a 95% confidence interval
12 9 7 2 8 7 3 27 21 10 13 7 2 307 6 13 6 4 1 10 3 13 6 2 9 2 12 16 18 Contuoto00onfidence interval c
The driving distances (in miles) to work of 30 people
are shown below. Assume the population standard deviation is 8
miles.
Construct a 95% confidence interval
12 9 7 2 8 7 3 27 21 10 13 7 2 307 6 13 6 4 1 10 3 13 6 2 9 2 12 16 18 Contuoto00onfidence interval c
 In a random sample of ten people, the mean driving distance to work was 18.6 miles and the standard deviation was 6.5 miles. Assume the population is normally distributed and use the t-distribution to find the margin of error and construct a 90% confidence interval for the population mean . Interpret the results. Identify the margin of error. (Round to one decimal place as needed.) Construct a 90% confidence interval for the population mean (Round to one decimal place as...
 idenitfy the margin of error( round to one decimal place) is
it square miles? miles? miles ler hour?
construct a 90% confidence interval for the population
mean?
interpret
of 14 10 complete HW Score: 41.84, 5.86 of 14 Score: 0 of 1 pt X 6.2.18-T Question in a random sample of twee people, the mean driving dance to work was 24.1. 90% confidence interval for the population mean Interpret the results and the sandard deviation was 75 miles. Assume the...
idenitfy the margin of error( round to one decimal place) is
it square miles? miles? miles ler hour?
construct a 90% confidence interval for the population
mean?
interpret
of 14 10 complete HW Score: 41.84, 5.86 of 14 Score: 0 of 1 pt X 6.2.18-T Question in a random sample of twee people, the mean driving dance to work was 24.1. 90% confidence interval for the population mean Interpret the results and the sandard deviation was 75 miles. Assume the...
 what is the margin of error and the confidence interval?
Question Help In a random sample of seven people, the mean driving distance to work was 24.7 miles and the standard deviation was 6.6 miles. Assuming the population is normally distributed and using the I-distribution, a 90% confidence interval for the population mean is (15.5, 33.9) (and the margin of error is 9.2). Through research, it has been found that the population standard deviation of driving distances to work is...
what is the margin of error and the confidence interval?
Question Help In a random sample of seven people, the mean driving distance to work was 24.7 miles and the standard deviation was 6.6 miles. Assuming the population is normally distributed and using the I-distribution, a 90% confidence interval for the population mean is (15.5, 33.9) (and the margin of error is 9.2). Through research, it has been found that the population standard deviation of driving distances to work is...
 {Exercise 8.41} Fewer young people are driving. In 1983, 87 percent of 19 year-olds had a driver's license. Twenty-five years later that percentage had dropped to 75 percent (University of Michigan Transportation Research Institute website, April 7, 2012). Suppose these results are based on a random sample of 1,650 nineteen year-olds in 1983 and again in 2008. a. At 95% confidence, what is the margin of error and the interval estimate of the number of nineteen year old drivers in...
 41. W Fewer young people are driving. In 1983, 87% of 19-year-olds had a driver's license. Twenty-five years later that percentage had dropped to 75% (University of Michigan Transportation Research Institute website, April 7, 2012). Suppose these results are based on a random sample of 1200 19-year-olds in 1983 and again in 2008. a. At 95% confidence, what is the margin of error and the interval estimate of the number of 19-year-old drivers in 1983? b. At 95% confidence, what...
 EXerCIse 8.417. Fewer young people are driving. In 1983, 87 percent of 19 year-olds had a driver's license. Twenty-five years later that percentage had dropped to 75 percent (University of Michigan Transportation Research Institute website, April 7, 2012). Suppose these results are based on a random sample of 1,150 nineteen year-olds in 1983 and again in 2008. a. At 95% confidence, what is the marqin of error and the interval estimate of the number of nineteen year old drivers in...
Most questions answered within 3 hours.
-
PLEASE HELP, NO ONE IS ANSWERING MY QUESTION AND IT IS SUE TODAY
WORTH 20% OF...
asked 1 minute ago -
α = 0.0007889 T, I = 2.9 A
Other Magnetic Fields: First, based on your
value...
asked 1 minute ago -
This assignment is a continuation of the 2nd one. You as a HR
Manager, select an...
asked 3 minutes ago -
Hastings Entertainment has a beta of 0.64. If the market return
is expected to be 13.80...
asked 14 minutes ago -
9. Depository institutions are always:
a. illiquid
b. profitable
c. insolvent
d. all of the above...
asked 23 minutes ago -
Use AstroTurf Company's income statement below to answer the
following two questions. Answer these questions with...
asked 22 minutes ago -
How is a firm's task
environment different from its general environment? Provide
examples of both types...
asked 20 minutes ago -
What is one reason Innovators can adopt innovations so
early?
Group of answer choices
they are...
asked 23 minutes ago -
Show that min x^2, s.t. x>=2 has strong duality.
asked 23 minutes ago -
Using curved arrows show how the intermediate formed in this
reaction (Hexaphenylbenzene is prepared through a...
asked 29 minutes ago -
Two lightbulbs operate on the same current. Bulb A has four
times the power output of...
asked 25 minutes ago -
1. What five (5) basic parameters need to be measured
during a pump test in order...
asked 37 minutes ago