Visit the Yahoo web site and click the link to Finance. Enter the letters "XOM" into...
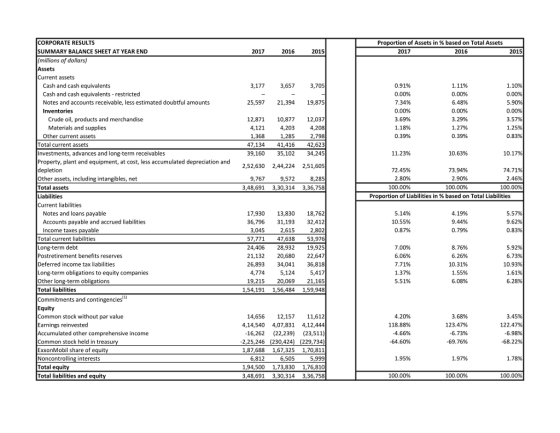
Visit the Yahoo web site and click the link to Finance. Enter the letters "XOM" into the Quote Lookup box, and this will display the latest stock price, related stock data, and links to the financial statements for Exxon-Mobil Corporation ("XOM" is the stock symbol for this company). Using the available data, indicate the EPS and P/E ratios. Next, digging deeper into the financials, perform a horizontal analysis spanning the latest three years of data, specifically showing the trends (change over time) for earnings, inventory, the company's cash position, and also indicate the trend for the gross profit ratio and profit margin ratio. In addition, perform a vertical analysis over all of the asset classes listed on the Balance Sheet (as a proportion of the Total Assets). Summarize all of your findings, and be sure to display all calculations you've made in the process. Also provide conclusions regarding your assessment of what your analysis indicates about the current state of Exxon-Mobil.
Homework Answers
1) Basic EPC is 4.63 and Diluted EPS is also 4.63
2)P/E Ratio = MPS/EPS
MPS of XOM-Exxon-Mobil Corporation on 31st March 2018 is Rs. 83.64/-
=83.64/4.63 =18.06 times


Add Answer to:
Visit the Yahoo web site and click the link to Finance. Enter
the letters "XOM" into...
Class: ACCT-301 WEEK 3: RATIO ANALYSIS AND LIBRARY RESEARCH TASK isit the Yahoo web site and...
Class: ACCT-301 WEEK 3: RATIO ANALYSIS AND LIBRARY RESEARCH TASK isit the Yahoo web site and click the link to Finance. Enter the letters "XOM" into the Quote Lookup box, and this will display the latest stock price, related stock data, and links to the financial statements for Exxon-Mobil Corporation ("XOM" is the stock symbol for this company). Using the available data, indicate the EPS and P/E ratios. Next, digging deeper into the financials, perform a horizontal analysis spanning the...
COMPLETE THE FOLLOWING USING THE ATTACHED DOCUMENTS In this exercise, you will perform a financial statement...
 COMPLETE THE FOLLOWING USING THE ATTACHED DOCUMENTS
In this exercise, you will perform a financial statement analysis for Water Feature Designers Inc. You will perform horizontal/vertical analyses and create charts to highlight key information from these analyses. You will also calculate financial ratios and insert cell comments. Use this information to complete the ratio analysis. Ratio Current Ratio Debt-to-Equity Ratio Profit Margin 2016 7.62 0.17 .186 2015 3.45 0.28 292 2014 8.21 0.18 255 1. Open EA9-A2-FSA from your Chapter...
COMPLETE THE FOLLOWING USING THE ATTACHED DOCUMENTS
In this exercise, you will perform a financial statement analysis for Water Feature Designers Inc. You will perform horizontal/vertical analyses and create charts to highlight key information from these analyses. You will also calculate financial ratios and insert cell comments. Use this information to complete the ratio analysis. Ratio Current Ratio Debt-to-Equity Ratio Profit Margin 2016 7.62 0.17 .186 2015 3.45 0.28 292 2014 8.21 0.18 255 1. Open EA9-A2-FSA from your Chapter...
Can somebody help me with my accounting project, here are the instructions: Financial Analysis Project Project...
Can somebody help me with my accounting project, here are the instructions: Financial Analysis Project Project Requirements and Instructions Sheet Objective In accordance with the Knowledge, Skills and Abilities objectives of the course, you are required to evaluate the financial performance of a publicly traded US Corporation and write a 10 page (excluding appendix and other supporting documents) report on your findings. This event will help participants develop the ability to understand, analyze, and make decisions based on financial information—these...
 COMPLETE THE FOLLOWING USING THE ATTACHED DOCUMENTS
In this exercise, you will perform a financial statement analysis for Water Feature Designers Inc. You will perform horizontal/vertical analyses and create charts to highlight key information from these analyses. You will also calculate financial ratios and insert cell comments. Use this information to complete the ratio analysis. Ratio Current Ratio Debt-to-Equity Ratio Profit Margin 2016 7.62 0.17 .186 2015 3.45 0.28 292 2014 8.21 0.18 255 1. Open EA9-A2-FSA from your Chapter...
COMPLETE THE FOLLOWING USING THE ATTACHED DOCUMENTS
In this exercise, you will perform a financial statement analysis for Water Feature Designers Inc. You will perform horizontal/vertical analyses and create charts to highlight key information from these analyses. You will also calculate financial ratios and insert cell comments. Use this information to complete the ratio analysis. Ratio Current Ratio Debt-to-Equity Ratio Profit Margin 2016 7.62 0.17 .186 2015 3.45 0.28 292 2014 8.21 0.18 255 1. Open EA9-A2-FSA from your Chapter...
Most questions answered within 3 hours.
-
A business executive has the option to invest money in two
plans: Plan A guarantees that...
asked 1 hour ago -
Hello, can someone please help me answer this question?
How much heat is absorbed by a...
asked 1 hour ago -
. A marketing researcher conducted a survey of 25 shoppers
randomly selected at the local mall...
asked 1 hour ago -
Create an comprehensive response to the
following:
Antimicrobial agents work on a multitude of microbes (bacteria,...
asked 1 hour ago -
6.13 LAB: Step counter. Section 6.3.
A pedometer treats walking 2,000 steps as walking 1 mile....
asked 1 hour ago -
(14.2) A block of mass m = 10 kg riding on a frictionless
horizontal plane is...
asked 1 hour ago -
Use any search engine to search for articles about Starbucks
partnership with Tata Companies in India...
asked 1 hour ago -
Let’s say that for some reason Bank Excess Reserves suddenly
increase sharply. What effect would this...
asked 1 hour ago -
Given:
Curent Assets: $600,000
Total Assets: $2,600,000
Current Liabilities: $500,000
Total Liabilities: $1,700,000
What is the...
asked 1 hour ago -
1. What is a “Bankster”? What is insider trading? Why is it
illegal?
2. What is...
asked 1 hour ago -
A transverse wave on a cord is given by
D(x,t)=0.18sin(2.7x−61.0t), where Dand x are in m...
asked 1 hour ago -
ASSIGNMENT
ANSWER ANY TWO OF THE FOLLOWING IN 2-3 PARAGRAPHS OF EACH
QUESTION.
1: Where is...
asked 1 hour ago