Consider the hypothesis
please ignore the answers in the photos they are from a previous problem, thank u!!!

Homework Answers
Answer
Given that
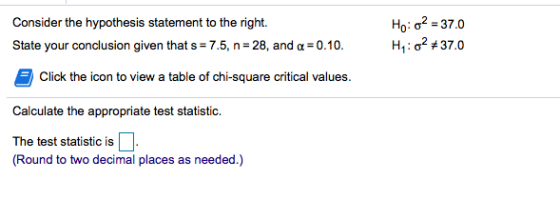
s = 7.5, n= 28, alpha = 0.10
sigma^2 = 37
test statistic = [(n-1)*s^2]/sigma^2
= [(28-1)*7.5^2]/37
= 1518.75/37
= 41.05
critical value= CHISQ.INV(alpha, n-1)
setting alpha = 0.10 and n = 28
critical value(left tailed) = CHISQ.INV(0.10,27) = 18.114
and right tailed critical value = CHISQ.INV.RT(0.10,27) = 36.741
Reject Ho because the test statistic is out of critical value range
Reject Ho, there is sufficient evidence to conclude that sigma^2 is different from 37
Add Answer to:
Consider the hypothesis
please ignore the answers in the photos they are from a previous
problem,...
Consider the hypothesis statement to the right using α-0.10 and the data to the right from...
 Consider the hypothesis statement to the right using α-0.10 and the data to the right from two independent samples. a) Calculate the appropriate test statistic and interpret the result. b) Calculate the p-value and interpret the result. x87 ƠI : 22 n-55 σ2 18 a) The test statistic is Round to two decimal places Determine the appropriate critical value(s. The critical value(s) is(are) as needed.) Round to two decimal places as needed. Use a comma to separate answers as needed.)...
Consider the following hypothesis test. Given that n = 78, o = 11, x = 50.7,...
 Consider the following hypothesis test. Given that n = 78, o = 11, x = 50.7, and a = 0.10, complete parts a through d below. Ho:us 48 Ha:p> 48 a. State the decision rule in terms of the critical value(s) of the test statistic. the critical value(s), . Otherwise, do not reject the null Reject the null hypothesis if the calculated value of the test statistic, z, is greater than hypothesis. (Round to two decimal places as needed. Use...
Consider the hypothesis statement to the right using a = 0.01 and the data to the...
 Consider the hypothesis statement to the right using a = 0.01 and the data to the right from two independent samples. a) Calculate the appropriate test statistic and interpret the result. b) Calculate the p-value and interpret the result. Click here to view page 1 of the standard normal table. Click here to view page 2 of the standard normal table. Ho H1 H250 H:H1-H2> 0 X = 90 x2 = 83 02 = 20 0 = 23 n =...
Consider the hypothesis statement shown below using a 0.05 and the data to the right from...
 Consider the hypothesis statement shown below using a 0.05 and the data to the right from two independent samples. Х,-113 x2-129 ơ,-41 ơ,-33 40 2-55 a) Calculate the appropriate test statistic and interpret the result. b) Calculate the p-value and interpret the result. Click here to view page 1 of the standard normal table. Click here to view page 2 of the standard normal table a) The test statistic is Round to two decimal places as needed.) Determine the appropriate...
Consider the following hypothesis statement using α 0.10 and the following data from two independent samples....
 Consider the following hypothesis statement using α 0.10 and the following data from two independent samples. Complete parts a and b below X2=57 2-120 Ho: P1-P220 X1-51 n1-125 Click here to view page 1 of the standard normal table. a. Calculate the appropriate test statistic and interpret the result What is the test statistic? (Round to two decimal places as needed.) What is/are the critical value(s)? (Round to two decimal places as needed. Use a comma to separate answers as...
13.1.3 Question Help Consider the hypothesis statement to the right. State your conclusion given that s-53,...
 13.1.3 Question Help Consider the hypothesis statement to the right. State your conclusion given that s-53, n-31, and H0: σ2-20.0 H1:02 #20.0 -0.05 . Click the icon to view a table of chi-square critical values Calculate the appropriate test statistic. The test statistic is (Round to two decimal places as needed.) Enter your answer in the answer box and then click Check Answer parts remaining Clear All Check Answer
Consider the hypothesis statement to the right using alpha equals0.10 and the data to the right...
Consider the hypothesis statement to the right using alpha equals0.10 and the data to the right from two independent samples. a) Calculate the appropriate test statistic and interpret the result. b) Calculate the p-value and interpret the result. Click here to view page 1 of the standard normal table. LOADING... Click here to view page 2 of the standard normal table. LOADING... H0: mu 1minusmu2less than or equals 0 H1: mu 1minusmu2greater than 0 x overbar 1 equals 87 x...
Consider the following hypothesis test. Given that n = 79,0 = 7, X = 49 6,...
 Consider the following hypothesis test. Given that n = 79,0 = 7, X = 49 6, and a = 0.05, complete parts a through d below Ho us 48 HA -> 48 vis a State the decision rule in terms of the critical value(s) of the test statistic Reject the null hypothesis if the calculated value of the test statistic, the critical value(s) otherwise, do not reject the mult (Round to two decimal places as needed. Use a comma to...
3 4 5 Consider the hypothesis statement shown below using a +0.10 and the data to...
 3 4 5 Consider the hypothesis statement shown below using a +0.10 and the data to the right from two independent X = 127 X=139 samples 0,= 33 0,=37 Ho: H - H220 n - 50 ny = 35 H: HH20 a) Calculate the appropriate test statistic and interpret the result. b) Calculate the p-value and interpret the result. Click here to view page 1 of the standard normal table. Click here to view page 2 of the standard normal...
Consider the following hypothesis statement using α-0.10 and the follo ing data from two independent sam...
 Consider the following hypothesis statement using α-0.10 and the follo ing data from two independent sam les. Complete arts a and belov. x2 39 2120 Ho: P1-P2 20 x1-58 1-175 Click here to view page 1 of the standard normal table a. Calculate the appropriate test statistic and interpret the result. What is the test statistic? (Round to two decimal places as needed.) What is/are the critical value(s)? Round to two decimal places as needed. Use a comma to separate...
 Consider the hypothesis statement to the right using α-0.10 and the data to the right from two independent samples. a) Calculate the appropriate test statistic and interpret the result. b) Calculate the p-value and interpret the result. x87 ƠI : 22 n-55 σ2 18 a) The test statistic is Round to two decimal places Determine the appropriate critical value(s. The critical value(s) is(are) as needed.) Round to two decimal places as needed. Use a comma to separate answers as needed.)...
 Consider the following hypothesis test. Given that n = 78, o = 11, x = 50.7, and a = 0.10, complete parts a through d below. Ho:us 48 Ha:p> 48 a. State the decision rule in terms of the critical value(s) of the test statistic. the critical value(s), . Otherwise, do not reject the null Reject the null hypothesis if the calculated value of the test statistic, z, is greater than hypothesis. (Round to two decimal places as needed. Use...
 Consider the hypothesis statement to the right using a = 0.01 and the data to the right from two independent samples. a) Calculate the appropriate test statistic and interpret the result. b) Calculate the p-value and interpret the result. Click here to view page 1 of the standard normal table. Click here to view page 2 of the standard normal table. Ho H1 H250 H:H1-H2> 0 X = 90 x2 = 83 02 = 20 0 = 23 n =...
 Consider the hypothesis statement shown below using a 0.05 and the data to the right from two independent samples. Х,-113 x2-129 ơ,-41 ơ,-33 40 2-55 a) Calculate the appropriate test statistic and interpret the result. b) Calculate the p-value and interpret the result. Click here to view page 1 of the standard normal table. Click here to view page 2 of the standard normal table a) The test statistic is Round to two decimal places as needed.) Determine the appropriate...
 Consider the following hypothesis statement using α 0.10 and the following data from two independent samples. Complete parts a and b below X2=57 2-120 Ho: P1-P220 X1-51 n1-125 Click here to view page 1 of the standard normal table. a. Calculate the appropriate test statistic and interpret the result What is the test statistic? (Round to two decimal places as needed.) What is/are the critical value(s)? (Round to two decimal places as needed. Use a comma to separate answers as...
 13.1.3 Question Help Consider the hypothesis statement to the right. State your conclusion given that s-53, n-31, and H0: σ2-20.0 H1:02 #20.0 -0.05 . Click the icon to view a table of chi-square critical values Calculate the appropriate test statistic. The test statistic is (Round to two decimal places as needed.) Enter your answer in the answer box and then click Check Answer parts remaining Clear All Check Answer
 Consider the following hypothesis test. Given that n = 79,0 = 7, X = 49 6, and a = 0.05, complete parts a through d below Ho us 48 HA -> 48 vis a State the decision rule in terms of the critical value(s) of the test statistic Reject the null hypothesis if the calculated value of the test statistic, the critical value(s) otherwise, do not reject the mult (Round to two decimal places as needed. Use a comma to...
 3 4 5 Consider the hypothesis statement shown below using a +0.10 and the data to the right from two independent X = 127 X=139 samples 0,= 33 0,=37 Ho: H - H220 n - 50 ny = 35 H: HH20 a) Calculate the appropriate test statistic and interpret the result. b) Calculate the p-value and interpret the result. Click here to view page 1 of the standard normal table. Click here to view page 2 of the standard normal...
 Consider the following hypothesis statement using α-0.10 and the follo ing data from two independent sam les. Complete arts a and belov. x2 39 2120 Ho: P1-P2 20 x1-58 1-175 Click here to view page 1 of the standard normal table a. Calculate the appropriate test statistic and interpret the result. What is the test statistic? (Round to two decimal places as needed.) What is/are the critical value(s)? Round to two decimal places as needed. Use a comma to separate...
Most questions answered within 3 hours.
-
Calculate the pH of each of the following solutions.
0.50 M HBr
3.1×10⁻⁴ M KOH
4.2×10⁻⁵...
asked 2 hours ago -
For the year ended December 31, Depot Max’s cost of merchandise
sold was $85,600. Inventory at the...
asked 2 hours ago -
Week 10 - Professional Memo Assignment
Professional Memo Assignment
Your mission for this week, should you...
asked 2 hours ago -
Write a Python program that stores the data for each
player on the team, and it...
asked 2 hours ago -
In
the last 3 months, mike never knows when he is going to get his
allowance...
asked 3 hours ago -
Is Ca(OH)2 a Bronsted base, Lewis base, or both? Why?
asked 2 hours ago -
1A- Why don’t voters complain about U.S. tariffs on imported
sugar?
Because sugar is only a...
asked 3 hours ago -
Cash Payback Period
Primera Banco is evaluating two capital investment proposals for
a drive-up ATM kiosk,...
asked 2 hours ago -
Create a button in Swift (Xcode) that will create a charge,
create a charge using Stripe's...
asked 2 hours ago -
The reaction rate of CO and NO2 in the reaction
CO(g) + NO2(g) → CO2(g) +...
asked 3 hours ago -
Imagine that a chemist puts 6.40 mol each of
C3H8 and O2 in a 1.00-L container...
asked 3 hours ago -
How much money should be invested today in order to have $8340
at the end of...
asked 3 hours ago