Robert recorded the number of calls he made at work during the week: Day Calls Monday...
Robert recorded the number of calls he made at work during the week:
| Day | Calls |
| Monday | 20 |
| Tuesday | 12 |
| Wednesday | 10 |
| Thursday | 18 |
He expected to make 15 calls each day. To determine whether the
number of calls follows a uniform distribution, a chi-square test
for goodness of fit should be performed (alpha = 0.05).
Using the data above, what is the chi-square test
statistic? Answer choices are rounded to the hundredths
place.
- a.)
0.67
- b.)
0.42
- c.)
4.54
- d.)
3.75
SUBMIT MY ANSWER
Homework Answers
Answer
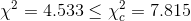
The value of Chi-Squared statistic = 4.54
hence, option c) is correct.
Solution:
The following table is obtained:
| Days | Calls (Observed) | Expected | (fo-fe)2/fe |
| Mon | 20 | 60*0.25=15 | (20-15)2/15 = 1.67 |
| Tue | 12 | 60*0.25=15 | (12-15)2/15 = 0.6 |
| Wed | 10 | 60*0.25=15 | (10-15)2/15 = 1.67 |
| Thurs | 18 | 60*0.25=15 | (18-15)2/15 = 0.6 |
 |
60 | 60 | 4.54 |
where,
fo = observed frrequency = Oi
fe = expected frequency = Ei
Null and Alternative Hypotheses
The following null and alternative hypotheses need to be tested:

Ha: Some of the population proportions differ from the values stated in the null hypothesis
This corresponds to a Chi-Square test for Goodness of Fit.
Rejection Region
Based on the information provided, the significance level is
α=0.05,
the number of degrees of freedom is df = 4 - 1 = 3
so the rejection region for this test is
R = { χ2 : χ2 > 7.815}
Test Statistics
The Chi-Squared statistic is,

Decision about the null hypothesis
Since it is observed that
it is then concluded that the null hypothesis is not rejected.
Conclusion
It is concluded that the null hypothesis Ho is not rejected.
Therefore, there is NOT enough evidence to claim that some of the population proportions differ from those stated in the null hypothesis, at α=0.05 significance level.
Add Answer to:
Robert recorded the number of calls he made at work during the
week:
Day
Calls
Monday...
Carl recorded the number of customers who visited his new storeduring the week:DayCustomers...
Carl recorded the number of customers who visited his new store during the week:DayCustomersMonday17Tuesday13Wednesday14Thursday16He expected to have 15 customers each day. To answer whether the number of customers follows a uniform distribution, a chi-square test for goodness of fit should be performed. (alpha = 0.10)What is the chi-squared test statistic? Answers are rounded to the nearest hundredth.
Brad recorded the number of visitors at the local science museum during the week. $$ \begin{array}{|l|l|}...
Brad recorded the number of visitors at the local science museum during the week. $$ \begin{array}{|l|l|} \hline \text { Day } & \text { Visitors } \\ \hline \text { Tuesday } & 18 \\ \hline \text { Wednesday } & 24 \\ \hline \text { Thursday } & 28 \\ \hline \text { Friday } & 30 \\ \hline \end{array} $$ He expected to see 25 visitors each day. To answer whether the number of visitors follows a uniform...
Are phone calls equally likely to occur any day of the week? The day of the...
Are phone calls equally likely to occur any day of the week? The day of the week for each of 504 randomly selected phone calls was observed. The results are displayed in the table below. Use an αα = 0.05 significance level. Complete the rest of the table by filling in the expected frequencies: Frequencies of Phone Calls for Each Day of the Week Outcome Frequency Expected Frequency Sunday 56 Monday 52 Tuesday 61 Wednesday 92 Thursday 73 Friday...
Are phone calls equally likely to occur any day of the week? The day of the...
 Are phone calls equally likely to occur any day of the week? The day of the week for each of 651 randomly selected phone calls was observed. The results are displayed in the table below. Use an a = 0.05 significance level. a. Complete the rest of the table by filling in the expected frequencies: Frequencies of Phone Calls for Each Day of the Week Outcome Frequency Expected Frequency Sunday 90 Monday 93 Tuesday 97 Wednesday 79 Thursday 89 Friday...
Are phone calls equally likely to occur any day of the week? The day of the...
Are phone calls equally likely to occur any day of the week? The day of the week for each of 525 randomly selected phone calls was observed. The results are displayed in the table below. Use an αα = 0.05 significance level. Complete the rest of the table by filling in the expected frequencies: Frequencies of Phone Calls for Each Day of the Week Outcome Frequency Expected Frequency Sunday 80 Monday 73 Tuesday 69 Wednesday 71 Thursday 80 Friday...
The following table represents the number of absences on various days of the week at an...
 The following table represents the number of absences on various days of the week at an elementary school. Monday Tuesday Wednesday Thursday Friday 45 32 17 25 38 Identify the critical value for a goodness-of- fit test, assuming a 0.05 significance level. = 11.071 =7.815 =9.488 r? =5.991
Employers want to know which days of the week employees are absent in a five-day work...
 Employers want to know which days of the week employees are absent in a five-day work week. Most employers would like to believe that employees are absent equally during the week. Suppose a random sample of managers were asked on which day of the week they had the highest number of employee absences. The results were distributed as follows: Number of Absences on Monday where 8 Number of Absences on Tuesday where 9 Number of Absences on Wednesday where 19...
What is the critical value of chi-square?
 The table below lists the number of crimes reported at a police station on each day of the week for the past three months. Day of the Week Monday Tuesday Wednesday Thursday Friday Saturday Sunday Number of Crimes 21 10 13 16 25 29 26 The null hypothesis for the goodness-of-fit test is that the number of crimes reported at this police station is the same for each day of the week The significance level is 10 %. What is the critical...
What is the expected number of crimes reported on a Thursday?
 The table below lists the number of crimes reported at a police station on each day of the week for the past three months. Day of the WeekNumber of Crimes Monday Tuesday Wednesday Thursday Friday Saturday Sunday The null hypothesis for the goodness-of-fit test is that the number of crimes reported at this police station is the same for each day of the week. What is the expected number of crimes reported on a Thursday?
Are phone calls equally likely to occur any day of the week? The day of the...
 Are phone calls equally likely to occur any day of the week? The day of the week for each of 700 randomly selected phone calls was observed. The results are displayed in the table below. Use an a=0.01 significance level. a. Complete the rest of the table by filling in the expected frequencies: Frequencies of Phone Calls for Each Day of the Week Outcome Frequency Expected Frequency Sunday 112 Monday 120 Tuesday 115 Wednesday 87 Thursday 73 Friday 91 Saturday...
 Are phone calls equally likely to occur any day of the week? The day of the week for each of 651 randomly selected phone calls was observed. The results are displayed in the table below. Use an a = 0.05 significance level. a. Complete the rest of the table by filling in the expected frequencies: Frequencies of Phone Calls for Each Day of the Week Outcome Frequency Expected Frequency Sunday 90 Monday 93 Tuesday 97 Wednesday 79 Thursday 89 Friday...
 The following table represents the number of absences on various days of the week at an elementary school. Monday Tuesday Wednesday Thursday Friday 45 32 17 25 38 Identify the critical value for a goodness-of- fit test, assuming a 0.05 significance level. = 11.071 =7.815 =9.488 r? =5.991
 Employers want to know which days of the week employees are absent in a five-day work week. Most employers would like to believe that employees are absent equally during the week. Suppose a random sample of managers were asked on which day of the week they had the highest number of employee absences. The results were distributed as follows: Number of Absences on Monday where 8 Number of Absences on Tuesday where 9 Number of Absences on Wednesday where 19...
 The table below lists the number of crimes reported at a police station on each day of the week for the past three months. Day of the Week Monday Tuesday Wednesday Thursday Friday Saturday Sunday Number of Crimes 21 10 13 16 25 29 26 The null hypothesis for the goodness-of-fit test is that the number of crimes reported at this police station is the same for each day of the week The significance level is 10 %. What is the critical...
 The table below lists the number of crimes reported at a police station on each day of the week for the past three months. Day of the WeekNumber of Crimes Monday Tuesday Wednesday Thursday Friday Saturday Sunday The null hypothesis for the goodness-of-fit test is that the number of crimes reported at this police station is the same for each day of the week. What is the expected number of crimes reported on a Thursday?
 Are phone calls equally likely to occur any day of the week? The day of the week for each of 700 randomly selected phone calls was observed. The results are displayed in the table below. Use an a=0.01 significance level. a. Complete the rest of the table by filling in the expected frequencies: Frequencies of Phone Calls for Each Day of the Week Outcome Frequency Expected Frequency Sunday 112 Monday 120 Tuesday 115 Wednesday 87 Thursday 73 Friday 91 Saturday...
Most questions answered within 3 hours.
-
3) What are the typical social structures in a global city?
asked 1 hour ago -
Luther Corporation
Consolidated Balance Sheet
December 31, 2019 and 2018 (in $ millions)
Assets
2019
2018...
asked 1 hour ago -
(Expected rate of return and risk) Carter Inc. is evaluating a
security. Calculate the investment’s expected...
asked 3 hours ago -
What specific indicators can point to lack of progress for
African Americans in American society?
asked 4 hours ago -
1-The Electrons in a beam are moving at 2.7×10⁸ m/s in an
electric field of 15000...
asked 5 hours ago -
A gas tank is a vertical cylinder. It has a radius of 1m, a
height of...
asked 5 hours ago -
Accent Software faces the following conditions. All of these
support Accent’s use of a market-penetration pricing...
asked 6 hours ago -
A mathematically inclined friend emails you the following
instructions: "Meet me in the cafeteria the first...
asked 6 hours ago -
A monopoly sells in two countries . The demand curves in the two
countries are p1...
asked 7 hours ago -
A .15kg rubber ball is bounced off a wall. Before hitting the
wall, the ball moves...
asked 8 hours ago -
A manufacturing company preparing to build a new plant is
considering three potential locations for it....
asked 8 hours ago -
B. If compound Y has approximately the same values of solubility
in toluene as compound X,...
asked 9 hours ago