The following payoff table provides profits based on various possible decision alternatives and various levels of demand at Amber Gardner's software firm:
| Demand Level | |||
| 0.3 | 0.7 | ||
| Low | High | ||
| Alternative | A | $10,000 | $30,000 |
| B | $5,000 | $40,000 | |
| C | ($2,000) | $50,000 | |
| *Profits in $ thousands | |||
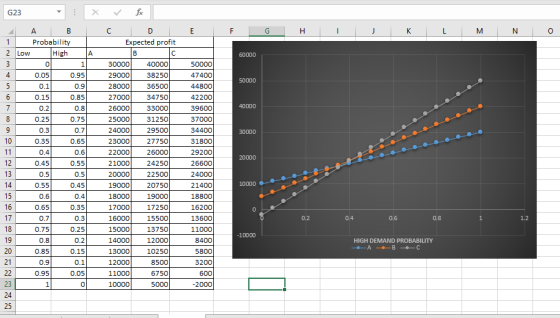
a. Plot the expected-value lines on a graph. (Answered below)
| Alternative | Demand Level | ||
| 0 | 1 | ||
| A | $ 10,000.00 | $ 30,000.00 | |
| B | $ 5,000.00 | $ 40,000.00 | |
| C | $ (2,000.00) | $ 50,000.00 | |

b. Is there any alternative that would never be appropriate in terms of maximizing expected profit? Explain on the basis of your graph. (see graph in part a)
c. For what range of P(High Demand) would alternative A be the best choice if the goal is to maximize expected profit?
d. For what range of P(High Demand) would alternative B be the best choice if the goal is to maximize expected profit?
e. Compute the expected values for each alternative if the probability of low demand level is 0.30. Which of the the options is best under this probability?
f. Using the probability of low demand as 0.3 (therefore probability of high demand = 0.7), compute the EVPI. Explain the significance of this number (i.e. what does it mean?).
Homework Answers
a)

b)
There is no such alternative. Every alternative has the highest payoff at some probability range
c)
Alternative A is best for H=0 and above
Let the upper limit be p
When P(high) =p, A and B would be same and after that B would give better payoff
To find p, Expected payoff of A = expected payoff of B
10000*(1-p)+30000*p = 5000*(1-p)+40000*p
p = 0.333
d)
The lower limit is found is part c.
At the upper limit, ::
At this probability payoff of B and C would be same
Let probability of high demand be p
5000*(1-p)+40000*p = -2000*(1-p)+50000*p
p = 0.412
Therefore, B is best for 0.333<= P(high) <= 0.412
e)
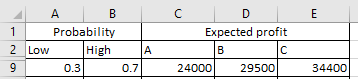
Can be seen from the table in the first part
f)
Expected value with out perfect information = max(24000,29500,34400) = 34400
When there is perfect information, under each demand condition, best possible alternative is chosen.
Expected value with perfect information = 0.3*10000+0.7* 50000 = 38000
EVPI = 38000-34400= 3600
Add Answer to:
The following payoff table provides profits based on various
possible decision alternatives and various levels of...
The following payoff table provides profits based on various possible decision alternatives and various levels of...
The following payoff table provides profits based on various possible decision alternatives and various levels of demand at Amber Gardner's software firm: Demand Level 0.70 0.30 Low High Alternative A $12,500 $30,000 B $7,500 $41,000 C ($2,000) $50,000 *Profits in $ thousands Using Excel, create an X,Y plot the expected-value lines for the three alternatives on a graph. Label the graph completely and clearly. (5 pts) Is there any alternative that would never be appropriate in terms of maximizing expected...
The following payoff table provides profits based on various possible decision alternatives and various levels of...
The following payoff table provides profits based on various possible decision alternatives and various levels of demand with probabilities of different demands: States of Nature Demand Alternatives Low Medium High Alternative A 80 120 140 Alternative B 70 90 100 Alternative C 30 60 120 Probability 0.4 0.3 0.3 What will be the expected value of perfect information (EVPI) for this situation?
The following payoff table provides profits based on various possible decision alternatives and various levels of...
The following payoff table provides profits based on various possible decision alternatives and various levels of demand at Robert Klassan's print shop: Decision Low High Alternative 1 $10,000 $30,000 Alternative 2 $6,000 $38,000 Alternative 3 -$2,500 $50,000 The probability of low demand is 0.350.35, whereas the probability of high demand is 0.650.65. A) The alternative that provides Robert the greatest expected monetary value (EMV) Which alternative? The decision is $? B) The EMV for this decision is $ (enter your...
The following payoff table provides profits based on various possible decision alternatives and various levels of...
 The following payoff table provides profits based on various possible decision alternatives and various levels of demand at Robert Klassan's print shop Demand Decision Low Alternative 1 $10,000 $36,000 Alternative 2 $5,000 Alternative 3$2.000 $52.000 High $40,000 The probability of low demand ie 0.35, whoreas the probability of high demand is 0,65 a) The altermative that provides Robert the greatest expected monetary value (EMV) is Alternative 3 he EMIV for this decision is (enter your answer as a whole numbor,...
The following payoff table provides profits based on various possible decision alternatives and various levels of...
The following payoff table provides profits based on various possible decision alternatives and various levels of demand with probabilities of different demands: States of Nature Demand Alternatives Low Medium High Alternative A 80 120 140 Alternative B 70 90 100 Alternative C 30 60 120 Probability 0.4 0.3 0.3 What will be the expected value of perfect information (EVPI) for this situation? 2. Given the following gasoline data: Quarter Year 1 Year 2 1 95 105 2 85 95 3...
3.2) The following payoff table provides profits based on various possible decision alternatives and various levels...
 3.2) The following payoff table provides profits based on various possible decision alternatives and various levels of demand. States of Nature Demand Alternatives Alternative 1 Alternative 2 Alternative 3 Low Medium High 75 90 50 120 90 70 140 90 120 The probability of a low demand is 0.4, while the probability of a medium demand is 0.4 and high demand is 0.2 (a) What decision would an optimist make? (b) What decision would a pessimist make? (c) What is...
The below payoff table gives profits from several decision alternatives and two different levels of demand....
 The below payoff table gives profits from several decision alternatives and two different levels of demand. Decision Alternative 1 Alternative 2 Alternative 3 Demand Low High $10,000 $36,000 $6,000 $42,000 -$2,000 $52,000 The probability of low demand is 0.35, whereas the probability of high demand is 0.65. a) The alternative that provides the greatest expected monetary value (EMV) is The EMV for this decision is $(enter your answer as a whole number). b) The expected value with perfect information (EVWPI)...
ABC Inc. must make a decision on its current capacity for next year. Estimated profits (in $000's) based on next year's demand are shown in the table below.
ABC Inc. must make a decision on its current capacity for next year. Estimated profits (in $000's) based on next year's demand are shown in the table below. Next Year's Demand Alternative Low Medium HighExpand $100 $200 $250Subcontract $50 $120 $125Do Nothing $40 $50 $ 55 a. Which alternative should be chosen based on the maximax criterion? b. Which alternative should be chosen based on the maximin...
Lecture Exercise #15 Consider the following payoff matrix: State of Nature Alternative High Demand (Prob. =...
 Lecture Exercise #15 Consider the following payoff matrix: State of Nature Alternative High Demand (Prob. = 0.7) Low Demand (Prob. = 0.3) Build Large Plant $150,000 $70,000 Build Small Plant $110,000 $90,000 Do Nothing 0 0 . Without any additional information, what is the best decision? What is the EMV? If perfect information is available, what is the EVPI? .
1. The following is a payoff table giving profits for various situations. Alternatives A B C...
1. The following is a payoff table giving profits for various situations. Alternatives A B C Alternative 1 120 140 120 Alternative 2 200 100 50 Alternative 3 100 120 180 Do Nothing 0 0 0 A recent forecast showed a 40% likelihood of A, a 10% likelihood of B, and a 50% likelihood of C. The decision criterion that now should be used to solve this problems is known as a. Equal Likelihood b. Expected Opportunity Loss c. Maximax...
 The following payoff table provides profits based on various possible decision alternatives and various levels of demand at Robert Klassan's print shop Demand Decision Low Alternative 1 $10,000 $36,000 Alternative 2 $5,000 Alternative 3$2.000 $52.000 High $40,000 The probability of low demand ie 0.35, whoreas the probability of high demand is 0,65 a) The altermative that provides Robert the greatest expected monetary value (EMV) is Alternative 3 he EMIV for this decision is (enter your answer as a whole numbor,...
 3.2) The following payoff table provides profits based on various possible decision alternatives and various levels of demand. States of Nature Demand Alternatives Alternative 1 Alternative 2 Alternative 3 Low Medium High 75 90 50 120 90 70 140 90 120 The probability of a low demand is 0.4, while the probability of a medium demand is 0.4 and high demand is 0.2 (a) What decision would an optimist make? (b) What decision would a pessimist make? (c) What is...
 The below payoff table gives profits from several decision alternatives and two different levels of demand. Decision Alternative 1 Alternative 2 Alternative 3 Demand Low High $10,000 $36,000 $6,000 $42,000 -$2,000 $52,000 The probability of low demand is 0.35, whereas the probability of high demand is 0.65. a) The alternative that provides the greatest expected monetary value (EMV) is The EMV for this decision is $(enter your answer as a whole number). b) The expected value with perfect information (EVWPI)...
 Lecture Exercise #15 Consider the following payoff matrix: State of Nature Alternative High Demand (Prob. = 0.7) Low Demand (Prob. = 0.3) Build Large Plant $150,000 $70,000 Build Small Plant $110,000 $90,000 Do Nothing 0 0 . Without any additional information, what is the best decision? What is the EMV? If perfect information is available, what is the EVPI? .
Most questions answered within 3 hours.
-
Two noble gases (Ne and He) are injected into the chambers of an
insulated container. Each...
asked 1 minute from now -
Suppose you purchase a zero coupon bond with a face value of
$1,000, maturing in 18...
asked 2 minutes ago -
Explain how blackbody radiation led to the idea of "quanta."
Will rate answer!
asked 3 minutes ago -
Do you believe that the $785,000 amount at the center of the
Overstock-Grant Thornton dispute was...
asked 4 minutes ago -
Find and , the mean and standard deviation of the
sampling distribution of :
μ = 25,...
asked 28 minutes ago -
According to the manufacturer of a certain candy, 9% of the
candy produced are red. If...
asked 46 minutes ago -
A Eucher Deck consists of 24 cards. In a four- player game, each
player is dealt...
asked 1 hour ago -
This is a challenging question.
The titration of an impure sample of KHP found that 36.00...
asked 1 hour ago -
1. Starting from rest, an automatic subway train is controlled
by a computer
that causes it’s...
asked 28 minutes ago -
You place a block of
ice (mass of 3 kg) into a test chamber filled with...
asked 1 hour ago -
If a benzene ring has one -CF3 group as a
substituent, will the next substituent add...
asked 52 minutes ago -
CORPORATE FINANCE
STATEMENT: If the total risk of a stock is high you can
expect the...
asked 42 minutes ago