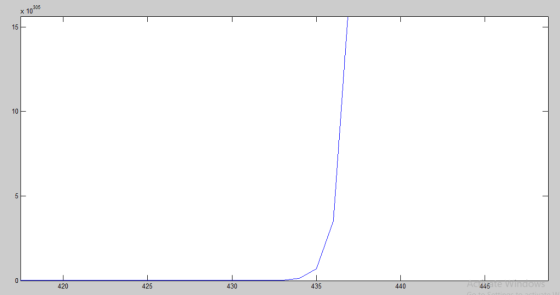
![Write a MATLAB function to compute and plot the output of the discrete-time system for x[n]-u[n], 0 < n < 1000. Based on thes](http://img.homeworklib.com/questions/3bdc09f0-cc6f-11eb-a9a7-15d91a16e67f.png?x-oss-process=image/resize,w_560)
Homework Answers
![ments MATLAB Command Window >>n0:1000; a = [1-5]; xi = 1; zi = filtic (b, a, yǐ , xi); yfilter (b,a,ul,zi); plot (n, y)](http://img.homeworklib.com/questions/3c699740-cc6f-11eb-b825-f18d64d1374a.png?x-oss-process=image/resize,w_560)
Add Answer to:
Please solve using MATLAB.
Write a MATLAB function to compute and plot the output of the...
Write a Matlab function that argument of the function that represents the sam function that plots...
 Write a Matlab function that argument of the function that represents the sam function that plots the following signal for O<t<700Ts (where Ts is the " that represents the sampling frequency) x(t) = 2n=-50 4k,sinc(t - nt's) where kn ( 1 if n = 0 Note: sinc(x)=sin(nx)/(xx) of n0
Matlab signals and systems
To understand better the concept of time-invariance in discrete-time systems, write a MATLAB M-file that generates the output response y[n] for 0 n 30 to thefollowing various inputs for the system defined in the previous question:(a) Compute and give the MATLAB plot of the response y1(n) to the input x(n)=u(n)(b) Compute and give the MATLAB plot of the response y2(n) to the input x(n)=u[n- 2]. Compare this response with that obtained in part (a).
A causal discrete-time system is described by the following difference equation: Use Matlab to write a...
 A causal discrete-time system is described by the following difference equation: Use Matlab to write a script to complete the following tasks. Turn in the output created by the Matlab "publish" utility. (a) Compute and plot the impulse response h[n], 0くn 〈 50. Use the function h=imp2(b, a , N ) to find the impulse response, and use the stem ) function to create the plot. (b) Let x[n] be defined by (n - 15)2 0n K 30 x[n] elsewhere...
for the plot, provide the matlab code. 3. Let the input signal x[n] (defined for -<n...
 for the plot, provide the matlab code.
3. Let the input signal x[n] (defined for -<n < oo) to the system be x[n] = 3 cos( 0.05πn) + 4 cos( 0.45πn) + cos( 0.95 n) and the transfer function be 1-re-je a) Plot this signal as a function of n. b) Determine and plot the output y[n] produced by the system due to the input analyzed in part a) of this problem. Do this first with r 0.05 and then...
for the plot, provide the matlab code.
3. Let the input signal x[n] (defined for -<n < oo) to the system be x[n] = 3 cos( 0.05πn) + 4 cos( 0.45πn) + cos( 0.95 n) and the transfer function be 1-re-je a) Plot this signal as a function of n. b) Determine and plot the output y[n] produced by the system due to the input analyzed in part a) of this problem. Do this first with r 0.05 and then...
solve using MatLab please. HW - 1 Use a cover page Word file attached for the...
 solve using MatLab please.
HW - 1 Use a cover page Word file attached for the homework solution. Solve all questions using Word and the Matlab output should be copied into the Word file. All questions and answers should be numbered HW1.1 Generate the following sequences using the basic MATLAB signal functions and the basic MATLAB signal operations discussed in this chapter. Plot signal samples using the stem function. 1- x(n) = n°[u(n+5] – u(n-6) + 105(n) + 20(0.5)* [u(n-4)...
solve using MatLab please.
HW - 1 Use a cover page Word file attached for the homework solution. Solve all questions using Word and the Matlab output should be copied into the Word file. All questions and answers should be numbered HW1.1 Generate the following sequences using the basic MATLAB signal functions and the basic MATLAB signal operations discussed in this chapter. Plot signal samples using the stem function. 1- x(n) = n°[u(n+5] – u(n-6) + 105(n) + 20(0.5)* [u(n-4)...
1) (2 pts) Write a script to plot the function 15V4r +10 r29 10 r<0 for-5ss...
 1) (2 pts) Write a script to plot the function 15V4r +10 r29 10 r<0 for-5ss 30
Problem 4.1 Using the course Matlab dtft function compute the magnitude, and phase for the following...
 Problem 4.1 Using the course Matlab dtft function compute the magnitude, and phase for the following discrete-time signal: a) x(n)=n(0.9)" [u(n)-u(n–21)] b) x(n) = cosTo» - 4 ][(n) – u (n – 40)]
Using the course Matlab dtft function compute the magnitude, and phase for the following discrete-time signal...
 Using the course Matlab dtft function compute the magnitude, and phase for the following discrete-time signal а) x(п) -п(09)[«(п)-и (п-21)] F [(a) -и (п- 40)] b) x (п) - =coS n 10 4 u --
Using the course Matlab dtft function compute the magnitude, and phase for the following discrete-time signal а) x(п) -п(09)[«(п)-и (п-21)] F [(a) -и (п- 40)] b) x (п) - =coS n 10 4 u --
Using the course Matlab dtft function compute the magnitude, and phase for the following discrete-time signal а) x(п) -п(09)[«(п)-и (п-21)] F [(a) -и (п- 40)] b) x (п) - =coS n 10 4 u --
BC:9.4 A LTI discrete time system has an impulse response h[n] = (-0.8)"u[n] + (0.65)"u[n-1] Find...
 BC:9.4 A LTI discrete time system has an impulse response h[n] = (-0.8)"u[n] + (0.65)"u[n-1] Find the transfer function, #(eo), in the normalized frequency domain. Use Matlab to plot the magni- tude and phase (in degrees) of H(eo) in the range of-? < ? < ?. Attach your Matlab source code with the plots. 1212 AM ^???4/4/2013
Please answer this question using Matlab: Write a matlab function to generate and plot a sine...
Please answer this question using Matlab: Write a matlab function to generate and plot a sine wave at a specified frequency having at least 10 cycles, for this case the amplitude will represent voltage. Your sine wave should have a positive going zero crossing at T=0. Make sure your plot has at least 25 samples per cycle. Make sure the plot is with respect to time. Your function needs to return your generated samples and time vector. The frequency will...
 Write a Matlab function that argument of the function that represents the sam function that plots the following signal for O<t<700Ts (where Ts is the " that represents the sampling frequency) x(t) = 2n=-50 4k,sinc(t - nt's) where kn ( 1 if n = 0 Note: sinc(x)=sin(nx)/(xx) of n0
 A causal discrete-time system is described by the following difference equation: Use Matlab to write a script to complete the following tasks. Turn in the output created by the Matlab "publish" utility. (a) Compute and plot the impulse response h[n], 0くn 〈 50. Use the function h=imp2(b, a , N ) to find the impulse response, and use the stem ) function to create the plot. (b) Let x[n] be defined by (n - 15)2 0n K 30 x[n] elsewhere...
 for the plot, provide the matlab code.
3. Let the input signal x[n] (defined for -<n < oo) to the system be x[n] = 3 cos( 0.05πn) + 4 cos( 0.45πn) + cos( 0.95 n) and the transfer function be 1-re-je a) Plot this signal as a function of n. b) Determine and plot the output y[n] produced by the system due to the input analyzed in part a) of this problem. Do this first with r 0.05 and then...
for the plot, provide the matlab code.
3. Let the input signal x[n] (defined for -<n < oo) to the system be x[n] = 3 cos( 0.05πn) + 4 cos( 0.45πn) + cos( 0.95 n) and the transfer function be 1-re-je a) Plot this signal as a function of n. b) Determine and plot the output y[n] produced by the system due to the input analyzed in part a) of this problem. Do this first with r 0.05 and then...
 solve using MatLab please.
HW - 1 Use a cover page Word file attached for the homework solution. Solve all questions using Word and the Matlab output should be copied into the Word file. All questions and answers should be numbered HW1.1 Generate the following sequences using the basic MATLAB signal functions and the basic MATLAB signal operations discussed in this chapter. Plot signal samples using the stem function. 1- x(n) = n°[u(n+5] – u(n-6) + 105(n) + 20(0.5)* [u(n-4)...
solve using MatLab please.
HW - 1 Use a cover page Word file attached for the homework solution. Solve all questions using Word and the Matlab output should be copied into the Word file. All questions and answers should be numbered HW1.1 Generate the following sequences using the basic MATLAB signal functions and the basic MATLAB signal operations discussed in this chapter. Plot signal samples using the stem function. 1- x(n) = n°[u(n+5] – u(n-6) + 105(n) + 20(0.5)* [u(n-4)...
 1) (2 pts) Write a script to plot the function 15V4r +10 r29 10 r<0 for-5ss 30
 Problem 4.1 Using the course Matlab dtft function compute the magnitude, and phase for the following discrete-time signal: a) x(n)=n(0.9)" [u(n)-u(n–21)] b) x(n) = cosTo» - 4 ][(n) – u (n – 40)]
 Using the course Matlab dtft function compute the magnitude, and phase for the following discrete-time signal а) x(п) -п(09)[«(п)-и (п-21)] F [(a) -и (п- 40)] b) x (п) - =coS n 10 4 u --
Using the course Matlab dtft function compute the magnitude, and phase for the following discrete-time signal а) x(п) -п(09)[«(п)-и (п-21)] F [(a) -и (п- 40)] b) x (п) - =coS n 10 4 u --
Using the course Matlab dtft function compute the magnitude, and phase for the following discrete-time signal а) x(п) -п(09)[«(п)-и (п-21)] F [(a) -и (п- 40)] b) x (п) - =coS n 10 4 u --
 BC:9.4 A LTI discrete time system has an impulse response h[n] = (-0.8)"u[n] + (0.65)"u[n-1] Find the transfer function, #(eo), in the normalized frequency domain. Use Matlab to plot the magni- tude and phase (in degrees) of H(eo) in the range of-? < ? < ?. Attach your Matlab source code with the plots. 1212 AM ^???4/4/2013
Most questions answered within 3 hours.
-
To buy a new house you must borrow $155,000. To do this you take
out a...
asked 18 minutes ago -
Spacely Sprockets is evaluating the construction of a new plant
on land the company purchased for...
asked 1 hour ago -
1. Consider a linear regression model of y on K regressors and
an intercept.
(i) Describe...
asked 1 hour ago -
Enter a balanced equation for the reaction between hydrochloric
acid and sodium sulfite.
Express your answer...
asked 1 hour ago -
Give a regular expression describing the language
{x | x ∈ Σ* and x does not...
asked 1 hour ago -
Masses of 1.0 kg, 2.0 kg, and 3.0 kg are each separately subject
to a net...
asked 1 hour ago -
The mode of philosophical argumentation and thought. How do
philosophers think and write? What is important...
asked 1 hour ago -
At the beginning of the unit, you were asked whether you thought
it was appropriate or...
asked 1 hour ago -
Calculate the grams of carbon in 9.32 x 10+23 molecules of
benzene (C6H6).
asked 1 hour ago -
A 5-year Treasury bond has a 4.95% yield. A 10-year Treasury
bond yields 6.6%, and a...
asked 1 hour ago -
suppose you own a chain of five restaurants in
downtown Vancouver. as the manager, you want...
asked 1 hour ago -
Here are summary statistics for randomly selected weights of
newborn girls:
nequals=225x overbarxequals=28.7hg, sequals=7.5hg. Construct a...
asked 1 hour ago