
Homework Answers
HW1.1
clc;close all;clear all;
n=-20:1:20;
x=((n.^2).*((n>=-5)-(n>=6)))+(10*(n==0))+(20*(0.5.^n).*((n>=4)-(n>=10)));
figure;
stem(n,x);xlabel('n');ylabel('x(n)');grid;
title('x(n)=(n^2 [u(n+5)-u(n+6)])+10 d(n)+20(0.5^n)[u(n-4)-u(n-10)]')
![x(n)=(n2 [u(n+5)-u(n+6)])+10 d(n)+20(0.5)[u(n-4)-u(n-10)] x(n) -20 -15 -10 -5 5 10 15 20](http://img.homeworklib.com/questions/11cd9580-bbcd-11ea-963c-61c079ce0273.png?x-oss-process=image/resize,w_560)
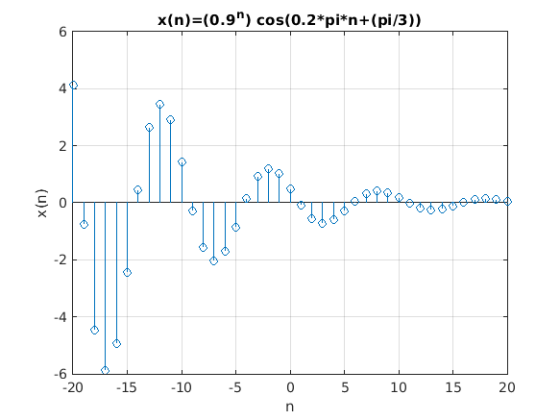
x=(0.9.^n).*(cos((0.2*pi*n)+(pi/3)));
figure;
stem(n,x);xlabel('n');ylabel('x(n)');grid;
title('x(n)=(0.9^n) cos(0.2*pi*n+(pi/3))')
________________________________________________________________________________________________
Add Answer to:
solve using MatLab please.
HW - 1 Use a cover page Word file attached for the...
Using the basic developed MATLAB signal functions, generate the following sequences and then plot the signal...
 Using the basic developed MATLAB signal functions, generate the following sequences and then plot the signal samples using the stem function. x_1[n] = 3 delta[n + 2] + 2 delta[n] - delta[n - 3] + 5 delta[n - 7], for -5 lessthanorequalto n lessthanorequalto 15. X_2[n] = 10u[n] - 5u[n - 5] - 10u[n - 10] + 5u[n - 15]. Generate the periodic sequence and plot the samples (using the stem function) of cap x[n] = {..., -2, -1, 0,...
Please provide MATLAB code and plot, about system response. Will thumbs up. Thanks. Question 1: MATLAB contains a built-...
 Please provide MATLAB code and plot, about system response. Will
thumbs up. Thanks.
Question 1: MATLAB contains a built-in function called conv which performs the convolution of two vectors: >> help conv conv Convolution and polynomial multiplication. C - conv(A, B) convolves vectors A and B. The resulting vector is length MAX ([LENGTH (A)+LENGTH (B)-1, LENGTH(A),LENGTH (B) 1) If A and B are vectors of polynomial coefficients, convolving them is equivalent to multiplying the two polynomials. Compute the system response...
Please provide MATLAB code and plot, about system response. Will
thumbs up. Thanks.
Question 1: MATLAB contains a built-in function called conv which performs the convolution of two vectors: >> help conv conv Convolution and polynomial multiplication. C - conv(A, B) convolves vectors A and B. The resulting vector is length MAX ([LENGTH (A)+LENGTH (B)-1, LENGTH(A),LENGTH (B) 1) If A and B are vectors of polynomial coefficients, convolving them is equivalent to multiplying the two polynomials. Compute the system response...
please write code in MATLAB as well 5. (12 points) Create the following signal in Matlab:...
 please write code in MATLAB as well
5. (12 points) Create the following signal in Matlab: x[n] = u(n) - u[n-6] a. Mathematically compute yi[n] = x[n] * x[n] where * means convolution. Now use the conv command to perform the convolution. Graph x[n) and the resulting y(n), both over the interval Osns 20. How many non-zero terms does y(n) have? Does your computational result agree with the Matlab result? b. Repeat a. but this time with yz[n] = x[n]*h[n)...
please write code in MATLAB as well
5. (12 points) Create the following signal in Matlab: x[n] = u(n) - u[n-6] a. Mathematically compute yi[n] = x[n] * x[n] where * means convolution. Now use the conv command to perform the convolution. Graph x[n) and the resulting y(n), both over the interval Osns 20. How many non-zero terms does y(n) have? Does your computational result agree with the Matlab result? b. Repeat a. but this time with yz[n] = x[n]*h[n)...
Please can you solve it using MATLAB. (1) Generate random signals [n] and hn, each of...
 Please can you solve it using MATLAB.
(1) Generate random signals [n] and hn, each of length N, and measure the time it takes to compute the linear convolution of r[n using the linear convolution definition and using the FFT method . Plot a graph of the results for N 104 to 10 in steps of 10. (2) Consider the signal x[n]-cos(0.3n),。£11S 100. Generate a plot of: ·The magnitude and phase of the DTFT of x[n] for 0 2π The...
Please can you solve it using MATLAB.
(1) Generate random signals [n] and hn, each of length N, and measure the time it takes to compute the linear convolution of r[n using the linear convolution definition and using the FFT method . Plot a graph of the results for N 104 to 10 in steps of 10. (2) Consider the signal x[n]-cos(0.3n),。£11S 100. Generate a plot of: ·The magnitude and phase of the DTFT of x[n] for 0 2π The...
using matlab thanks A Share Sgn in eHome Insert Design Leyout References Man Batch 1 Midterm Practical x(n)-1 3 ura) + u(n-18); for n:0 to 79 h(n)- 2un-15); for n-0 to 79 Without using the functio...
 using matlab thanks
A Share Sgn in eHome Insert Design Leyout References Man Batch 1 Midterm Practical x(n)-1 3 ura) + u(n-18); for n:0 to 79 h(n)- 2un-15); for n-0 to 79 Without using the function "conv", plot the convolution response of the given discrete-time signals xin),input signal and hn), impulse response use subplot to present these signals and the output. Submit your work/compilation in Canvas feuinstructure.com zooM+ of 5 Convolution n)hn-k). for -012 1-0 Where M-N-N-1 Nlength of sequenceI...
using matlab thanks
A Share Sgn in eHome Insert Design Leyout References Man Batch 1 Midterm Practical x(n)-1 3 ura) + u(n-18); for n:0 to 79 h(n)- 2un-15); for n-0 to 79 Without using the function "conv", plot the convolution response of the given discrete-time signals xin),input signal and hn), impulse response use subplot to present these signals and the output. Submit your work/compilation in Canvas feuinstructure.com zooM+ of 5 Convolution n)hn-k). for -012 1-0 Where M-N-N-1 Nlength of sequenceI...
Please solve using MATLAB. Write a MATLAB function to compute and plot the output of the...
 Please solve using MATLAB.
Write a MATLAB function to compute and plot the output of the discrete-time system for x[n]-u[n], 0 < n < 1000. Based on these results can you make a statement regarding the stability of the system? Hint: Check the value y[600]
Please solve using MATLAB.
Write a MATLAB function to compute and plot the output of the discrete-time system for x[n]-u[n], 0 < n < 1000. Based on these results can you make a statement regarding the stability of the system? Hint: Check the value y[600]
Its related to MATLAB Generate a continuous-time signal z(t)-cos(2π 10t + 5) + cos(2π30t + 5). You may use the part of...
 Its related to MATLAB
Generate a continuous-time signal z(t)-cos(2π 10t + 5) + cos(2π30t + 5). You may use the part of the followings. a >>t0:0.001:1; >plot (t, x_t) b. Generate a discrete-time signal x[n] = (1/4)(u[n]-u[n-4). You may use the part of the followings >>a_n-ones (1, 4) s> b_nzeros (1, 7) >> stem(n, x n)
Generate a continuous-time signal z(t)-cos(2π 10t + 5) + cos(2π30t + 5). You may use the part of the followings. a >>t0:0.001:1; >plot (t,...
Its related to MATLAB
Generate a continuous-time signal z(t)-cos(2π 10t + 5) + cos(2π30t + 5). You may use the part of the followings. a >>t0:0.001:1; >plot (t, x_t) b. Generate a discrete-time signal x[n] = (1/4)(u[n]-u[n-4). You may use the part of the followings >>a_n-ones (1, 4) s> b_nzeros (1, 7) >> stem(n, x n)
Generate a continuous-time signal z(t)-cos(2π 10t + 5) + cos(2π30t + 5). You may use the part of the followings. a >>t0:0.001:1; >plot (t,...
Matlab help 1) Given the functions x1()= tu()-tuft-1) and X2(t)=10e-5,11(), do the following: 1. Plotx,(t) and x2(0) using MATLAB 2. Use MATLAB to find and plot x(0=x:@*.x2(t), where * denotes co...
 Matlab help
1) Given the functions x1()= tu()-tuft-1) and X2(t)=10e-5,11(), do the following: 1. Plotx,(t) and x2(0) using MATLAB 2. Use MATLAB to find and plot x(0=x:@*.x2(t), where * denotes convolution. 3. Find x(t)=x;()*X2(1) by hand using Laplace transforms. 4. Plot the result of part 3 in MATLAB and compare it to that found in part 2. 2) Given the transfer function shown below, do the following: 1. Find the system's impulse response and plot it using MATLAB 2. Repeat...
Matlab help
1) Given the functions x1()= tu()-tuft-1) and X2(t)=10e-5,11(), do the following: 1. Plotx,(t) and x2(0) using MATLAB 2. Use MATLAB to find and plot x(0=x:@*.x2(t), where * denotes convolution. 3. Find x(t)=x;()*X2(1) by hand using Laplace transforms. 4. Plot the result of part 3 in MATLAB and compare it to that found in part 2. 2) Given the transfer function shown below, do the following: 1. Find the system's impulse response and plot it using MATLAB 2. Repeat...
PLEASE SOLVE IN MATLAB ! SOLVE IN MATLAB !SOLVE IN MATLAB !SOLVE IN MATLAB !SOLVE IN...
 PLEASE SOLVE IN MATLAB ! SOLVE IN MATLAB !SOLVE IN MATLAB !SOLVE
IN MATLAB !SOLVE IN MATLAB !
Question 4 [25pts]: Plot y[n] = cos(na) by using stem command. For the sake of visuality, take n from 0 to 30 with an increment of 1. Is the signal periodic? If so, please show its fundamental period from the plot.
PLEASE SOLVE IN MATLAB ! SOLVE IN MATLAB !SOLVE IN MATLAB !SOLVE
IN MATLAB !SOLVE IN MATLAB !
Question 4 [25pts]: Plot y[n] = cos(na) by using stem command. For the sake of visuality, take n from 0 to 30 with an increment of 1. Is the signal periodic? If so, please show its fundamental period from the plot.
Please answer all the questions Here is evenodd function: function [xe, xo, m] = evenodd(x,n) % R...
 Please answer all the questions
Here is evenodd function:
function [xe, xo, m] = evenodd(x,n)
% Real signal decomposition into even and odd parts
% -------------------------------------------------
% [xe, xo, m] = evenodd(x,n)
%
if any(imag(x) ~= 0)
error('x is not a real sequence')
end
m = -fliplr(n);
m1 = min([m,n]); m2 = max([m,n]); m = m1:m2;
nm = n(1)-m(1); n1 = 1:length(n);
x1 = zeros(1,length(m));
x1(n1+nm) = x; x = x1;
xe = 0.5*(x + fliplr(x));
xo = 0.5*(x -...
Please answer all the questions
Here is evenodd function:
function [xe, xo, m] = evenodd(x,n)
% Real signal decomposition into even and odd parts
% -------------------------------------------------
% [xe, xo, m] = evenodd(x,n)
%
if any(imag(x) ~= 0)
error('x is not a real sequence')
end
m = -fliplr(n);
m1 = min([m,n]); m2 = max([m,n]); m = m1:m2;
nm = n(1)-m(1); n1 = 1:length(n);
x1 = zeros(1,length(m));
x1(n1+nm) = x; x = x1;
xe = 0.5*(x + fliplr(x));
xo = 0.5*(x -...
 Using the basic developed MATLAB signal functions, generate the following sequences and then plot the signal samples using the stem function. x_1[n] = 3 delta[n + 2] + 2 delta[n] - delta[n - 3] + 5 delta[n - 7], for -5 lessthanorequalto n lessthanorequalto 15. X_2[n] = 10u[n] - 5u[n - 5] - 10u[n - 10] + 5u[n - 15]. Generate the periodic sequence and plot the samples (using the stem function) of cap x[n] = {..., -2, -1, 0,...
 Please provide MATLAB code and plot, about system response. Will
thumbs up. Thanks.
Question 1: MATLAB contains a built-in function called conv which performs the convolution of two vectors: >> help conv conv Convolution and polynomial multiplication. C - conv(A, B) convolves vectors A and B. The resulting vector is length MAX ([LENGTH (A)+LENGTH (B)-1, LENGTH(A),LENGTH (B) 1) If A and B are vectors of polynomial coefficients, convolving them is equivalent to multiplying the two polynomials. Compute the system response...
Please provide MATLAB code and plot, about system response. Will
thumbs up. Thanks.
Question 1: MATLAB contains a built-in function called conv which performs the convolution of two vectors: >> help conv conv Convolution and polynomial multiplication. C - conv(A, B) convolves vectors A and B. The resulting vector is length MAX ([LENGTH (A)+LENGTH (B)-1, LENGTH(A),LENGTH (B) 1) If A and B are vectors of polynomial coefficients, convolving them is equivalent to multiplying the two polynomials. Compute the system response...
 please write code in MATLAB as well
5. (12 points) Create the following signal in Matlab: x[n] = u(n) - u[n-6] a. Mathematically compute yi[n] = x[n] * x[n] where * means convolution. Now use the conv command to perform the convolution. Graph x[n) and the resulting y(n), both over the interval Osns 20. How many non-zero terms does y(n) have? Does your computational result agree with the Matlab result? b. Repeat a. but this time with yz[n] = x[n]*h[n)...
please write code in MATLAB as well
5. (12 points) Create the following signal in Matlab: x[n] = u(n) - u[n-6] a. Mathematically compute yi[n] = x[n] * x[n] where * means convolution. Now use the conv command to perform the convolution. Graph x[n) and the resulting y(n), both over the interval Osns 20. How many non-zero terms does y(n) have? Does your computational result agree with the Matlab result? b. Repeat a. but this time with yz[n] = x[n]*h[n)...
 Please can you solve it using MATLAB.
(1) Generate random signals [n] and hn, each of length N, and measure the time it takes to compute the linear convolution of r[n using the linear convolution definition and using the FFT method . Plot a graph of the results for N 104 to 10 in steps of 10. (2) Consider the signal x[n]-cos(0.3n),。£11S 100. Generate a plot of: ·The magnitude and phase of the DTFT of x[n] for 0 2π The...
Please can you solve it using MATLAB.
(1) Generate random signals [n] and hn, each of length N, and measure the time it takes to compute the linear convolution of r[n using the linear convolution definition and using the FFT method . Plot a graph of the results for N 104 to 10 in steps of 10. (2) Consider the signal x[n]-cos(0.3n),。£11S 100. Generate a plot of: ·The magnitude and phase of the DTFT of x[n] for 0 2π The...
 using matlab thanks
A Share Sgn in eHome Insert Design Leyout References Man Batch 1 Midterm Practical x(n)-1 3 ura) + u(n-18); for n:0 to 79 h(n)- 2un-15); for n-0 to 79 Without using the function "conv", plot the convolution response of the given discrete-time signals xin),input signal and hn), impulse response use subplot to present these signals and the output. Submit your work/compilation in Canvas feuinstructure.com zooM+ of 5 Convolution n)hn-k). for -012 1-0 Where M-N-N-1 Nlength of sequenceI...
using matlab thanks
A Share Sgn in eHome Insert Design Leyout References Man Batch 1 Midterm Practical x(n)-1 3 ura) + u(n-18); for n:0 to 79 h(n)- 2un-15); for n-0 to 79 Without using the function "conv", plot the convolution response of the given discrete-time signals xin),input signal and hn), impulse response use subplot to present these signals and the output. Submit your work/compilation in Canvas feuinstructure.com zooM+ of 5 Convolution n)hn-k). for -012 1-0 Where M-N-N-1 Nlength of sequenceI...
 Please solve using MATLAB.
Write a MATLAB function to compute and plot the output of the discrete-time system for x[n]-u[n], 0 < n < 1000. Based on these results can you make a statement regarding the stability of the system? Hint: Check the value y[600]
Please solve using MATLAB.
Write a MATLAB function to compute and plot the output of the discrete-time system for x[n]-u[n], 0 < n < 1000. Based on these results can you make a statement regarding the stability of the system? Hint: Check the value y[600]
 Its related to MATLAB
Generate a continuous-time signal z(t)-cos(2π 10t + 5) + cos(2π30t + 5). You may use the part of the followings. a >>t0:0.001:1; >plot (t, x_t) b. Generate a discrete-time signal x[n] = (1/4)(u[n]-u[n-4). You may use the part of the followings >>a_n-ones (1, 4) s> b_nzeros (1, 7) >> stem(n, x n)
Generate a continuous-time signal z(t)-cos(2π 10t + 5) + cos(2π30t + 5). You may use the part of the followings. a >>t0:0.001:1; >plot (t,...
Its related to MATLAB
Generate a continuous-time signal z(t)-cos(2π 10t + 5) + cos(2π30t + 5). You may use the part of the followings. a >>t0:0.001:1; >plot (t, x_t) b. Generate a discrete-time signal x[n] = (1/4)(u[n]-u[n-4). You may use the part of the followings >>a_n-ones (1, 4) s> b_nzeros (1, 7) >> stem(n, x n)
Generate a continuous-time signal z(t)-cos(2π 10t + 5) + cos(2π30t + 5). You may use the part of the followings. a >>t0:0.001:1; >plot (t,...
 Matlab help
1) Given the functions x1()= tu()-tuft-1) and X2(t)=10e-5,11(), do the following: 1. Plotx,(t) and x2(0) using MATLAB 2. Use MATLAB to find and plot x(0=x:@*.x2(t), where * denotes convolution. 3. Find x(t)=x;()*X2(1) by hand using Laplace transforms. 4. Plot the result of part 3 in MATLAB and compare it to that found in part 2. 2) Given the transfer function shown below, do the following: 1. Find the system's impulse response and plot it using MATLAB 2. Repeat...
Matlab help
1) Given the functions x1()= tu()-tuft-1) and X2(t)=10e-5,11(), do the following: 1. Plotx,(t) and x2(0) using MATLAB 2. Use MATLAB to find and plot x(0=x:@*.x2(t), where * denotes convolution. 3. Find x(t)=x;()*X2(1) by hand using Laplace transforms. 4. Plot the result of part 3 in MATLAB and compare it to that found in part 2. 2) Given the transfer function shown below, do the following: 1. Find the system's impulse response and plot it using MATLAB 2. Repeat...
 PLEASE SOLVE IN MATLAB ! SOLVE IN MATLAB !SOLVE IN MATLAB !SOLVE
IN MATLAB !SOLVE IN MATLAB !
Question 4 [25pts]: Plot y[n] = cos(na) by using stem command. For the sake of visuality, take n from 0 to 30 with an increment of 1. Is the signal periodic? If so, please show its fundamental period from the plot.
PLEASE SOLVE IN MATLAB ! SOLVE IN MATLAB !SOLVE IN MATLAB !SOLVE
IN MATLAB !SOLVE IN MATLAB !
Question 4 [25pts]: Plot y[n] = cos(na) by using stem command. For the sake of visuality, take n from 0 to 30 with an increment of 1. Is the signal periodic? If so, please show its fundamental period from the plot.
 Please answer all the questions
Here is evenodd function:
function [xe, xo, m] = evenodd(x,n)
% Real signal decomposition into even and odd parts
% -------------------------------------------------
% [xe, xo, m] = evenodd(x,n)
%
if any(imag(x) ~= 0)
error('x is not a real sequence')
end
m = -fliplr(n);
m1 = min([m,n]); m2 = max([m,n]); m = m1:m2;
nm = n(1)-m(1); n1 = 1:length(n);
x1 = zeros(1,length(m));
x1(n1+nm) = x; x = x1;
xe = 0.5*(x + fliplr(x));
xo = 0.5*(x -...
Please answer all the questions
Here is evenodd function:
function [xe, xo, m] = evenodd(x,n)
% Real signal decomposition into even and odd parts
% -------------------------------------------------
% [xe, xo, m] = evenodd(x,n)
%
if any(imag(x) ~= 0)
error('x is not a real sequence')
end
m = -fliplr(n);
m1 = min([m,n]); m2 = max([m,n]); m = m1:m2;
nm = n(1)-m(1); n1 = 1:length(n);
x1 = zeros(1,length(m));
x1(n1+nm) = x; x = x1;
xe = 0.5*(x + fliplr(x));
xo = 0.5*(x -...
Most questions answered within 3 hours.
-
LABORATORY EXERCISES:
Using nested for loops, write a java program to print the
pattern as shown...
asked 5 minutes ago -
a) The frequency of light coming out from a laser source is 297
MHz. What is...
asked 6 minutes ago -
Assume that the correlation coefficient between achievement test
scores (X) and grade point averages (Y) among...
asked 18 minutes ago -
In Chapter 1 titled "So Close and Yet So Different", in "Why
Nations Fail" authors bring...
asked 15 minutes ago -
Leadership Philosophy
Write a two-page paper identifying your personal leadership
philosophy based on your new perspective...
asked 12 minutes ago -
Which of these function correctly defines the function g(),
which should return a pointer to a...
asked 21 minutes ago -
Pickett Industries just paid a dividend of D0 = $1.10. Analysts
expect the company's dividend to...
asked 21 minutes ago -
Suppose a random sample of 900 measurements is taken from an
unknown population. The average of...
asked 24 minutes ago -
Suppose we add another SRC instruction xor ra, rb, rc that xors
the contents of registers...
asked 25 minutes ago -
Hello, I need some help creating this class in Java. This is for
a larger project....
asked 47 minutes ago -
Why does entrepreneurs trying to employ AI into their
business organizations? What are the advantages and...
asked 44 minutes ago -
// This program is supposed to display every fifth year
// starting with 2017; that is,...
asked 46 minutes ago