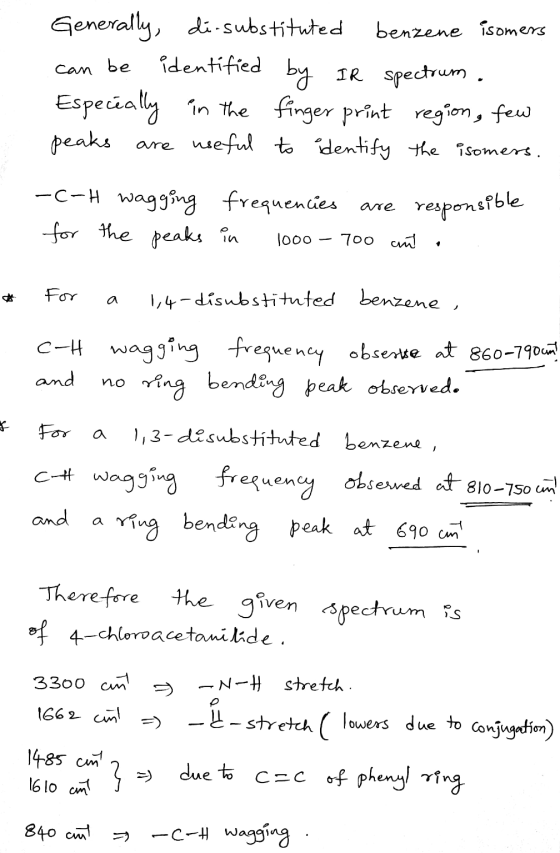
- What is the orientation of acetanilide group on the benzene ring?
- What can you say about the regioisomers that are formed if the melting point for 4-chloroacetanilide was 160-161˚C?
- Interpret the IR spectrum peaks of 4-chloroacetanilide

Homework Answers
Add Answer to:
What is the orientation of acetanilide group on the benzene
ring?
What can you say about...
IR spectrum of Iodination of Salicylamide, what product was produced? Please explain the peaks. There is a benzene ring...
 IR
spectrum of Iodination of Salicylamide, what product was produced?
Please explain the peaks. There is a benzene ring stretch at
3080cm-1 but what else?
Please explain
IR
Spec of Iodination of Salicylamide. what product is produced? and
what peaks show it
% Transmittance Peak list Sensitivity Region Spectrum FIND PEAKS Absolute threshold: 97.749 50 4000.00 4000 3500 A JO 3000 3080? 2500 Wavenumbers (cm-1) 2000 1750.52 1608 1472 1295 4253 1253.10 115009103.24067 1000 995.69 955-87 919.90 777 842 54...
IR
spectrum of Iodination of Salicylamide, what product was produced?
Please explain the peaks. There is a benzene ring stretch at
3080cm-1 but what else?
Please explain
IR
Spec of Iodination of Salicylamide. what product is produced? and
what peaks show it
% Transmittance Peak list Sensitivity Region Spectrum FIND PEAKS Absolute threshold: 97.749 50 4000.00 4000 3500 A JO 3000 3080? 2500 Wavenumbers (cm-1) 2000 1750.52 1608 1472 1295 4253 1253.10 115009103.24067 1000 995.69 955-87 919.90 777 842 54...
pls interpret and analyze both IR Spectrum . thanks philip/johnson 105 100 95 90- 85 80 75 70 65 60 55 50- 45- 50...
 pls interpret and analyze both IR Spectrum . thanks
philip/johnson 105 100 95 90- 85 80 75 70 65 60 55 50- 45- 500 1000 1500 2000 2500 3500 3000 4000 Wavenumbers (om-1) %Transmittance 100 philipljphnson 95- 85 80 75 70- 65- 60 55 50 4000 3500 1000 500 3000 1500 2500 2000 %Transmittance 90
philip/johnson 105 100 95 90- 85 80 75 70 65 60 55 50- 45- 500 1000 1500 2000 2500 3500 3000 4000 Wavenumbers (om-1) %Transmittance...
pls interpret and analyze both IR Spectrum . thanks
philip/johnson 105 100 95 90- 85 80 75 70 65 60 55 50- 45- 500 1000 1500 2000 2500 3500 3000 4000 Wavenumbers (om-1) %Transmittance 100 philipljphnson 95- 85 80 75 70- 65- 60 55 50 4000 3500 1000 500 3000 1500 2500 2000 %Transmittance 90
philip/johnson 105 100 95 90- 85 80 75 70 65 60 55 50- 45- 500 1000 1500 2000 2500 3500 3000 4000 Wavenumbers (om-1) %Transmittance...
Label all peaks of this IR spectrum. Please help me. 3500 3000 2961.48 2869.66 2500 Wavenumbers...
 Label all peaks of this IR spectrum. Please help
me.
3500 3000 2961.48 2869.66 2500 Wavenumbers (cm-1) 2000 1745.65 1500 1387.86 1368.87 1229.55 1000 500 Infrared Peak (cm) Structural Assignment
Label all peaks of this IR spectrum. Please help
me.
3500 3000 2961.48 2869.66 2500 Wavenumbers (cm-1) 2000 1745.65 1500 1387.86 1368.87 1229.55 1000 500 Infrared Peak (cm) Structural Assignment
May someone help me label all peaks of this IR spectrum. 3500 3000 2961.48 2869.66 2500...
 May someone help me label all peaks of this IR
spectrum.
3500 3000 2961.48 2869.66 2500 Wavenumbers (cm-1) 2000 1745.65 1500 1387.86 1368.87 1229.55 1000 500 Infrared Peak (cm) Structural Assignment
May someone help me label all peaks of this IR
spectrum.
3500 3000 2961.48 2869.66 2500 Wavenumbers (cm-1) 2000 1745.65 1500 1387.86 1368.87 1229.55 1000 500 Infrared Peak (cm) Structural Assignment
1) Identify the functional group (alkane, alkene, ketone, aldehyde, aldehyde, etc) for the compounds providing the...
 1) Identify the functional group (alkane, alkene, ketone, aldehyde, aldehyde, etc) for the compounds providing the IR spectra: % Transmittance 4000 3500 3000 1500 1000 500 2500 2000 Wavenumber(cm) % Transmittance 4000 3500 3000 1500 1000 500 2500 2000 Wavenumber(cm) % Transmittance 1000 3500 3000 1500 1000 500 2500 2000 Wavenumber (cm)
Interpret the IR spectrum. Assign peaks to the major functional groups present in Compound 3. %Transmittance...
 Interpret the IR spectrum. Assign peaks to the major
functional groups present in Compound 3.
%Transmittance 4000 451 3500 3000 2500 Wavenumbers (cm-1) 2000 1704.22 1582.94 1500 1455.74 1401.84 1360.52 1277.77 1199.79 1169,80 1000 1149.01 1090.22 1008 96 1024.98 COMPOUND 3 942.39 919 35 885.89 855.60 780.62 714.49
Interpret the IR spectrum. Assign peaks to the major
functional groups present in Compound 3.
%Transmittance 4000 451 3500 3000 2500 Wavenumbers (cm-1) 2000 1704.22 1582.94 1500 1455.74 1401.84 1360.52 1277.77 1199.79 1169,80 1000 1149.01 1090.22 1008 96 1024.98 COMPOUND 3 942.39 919 35 885.89 855.60 780.62 714.49
interpet the peaks of the IR spectrum and each funtional group present 289725 3419.06 29842356.39 333904...
 interpet the peaks of the IR spectrum and each funtional group
present
289725 3419.06 29842356.39 333904 3224 25 1631.00 1516.20 1683.18 1592.73 1% 3500 3000 2500 2000 1500 1000 515 cm-1
interpet the peaks of the IR spectrum and each funtional group
present
289725 3419.06 29842356.39 333904 3224 25 1631.00 1516.20 1683.18 1592.73 1% 3500 3000 2500 2000 1500 1000 515 cm-1
IR Worksheet 1. For each spectrum below: 1) Label the major peaks with their approximate frequency....
 IR Worksheet 1. For each spectrum below: 1) Label the major peaks with their approximate frequency. 2) Identify the bond vibration and possible functional group associated with each peak. 3) Match the spectra to one of these possible compounds: NH2 TRANSMITTANCE[%] pobo edo "2060 bo zdoo 160 Tobo 560 WAVENUMBER [cm-1] oot 08 TRANSMITTANCE [%] 09 01 02 4000 3500 3000 2500 2000 WAVENUMBER (cm-1] 1500 1000 500 οοο TRANSMITTANCE (6) οο οο οε 4000 3500 3000 1500 1000 2500...
Please evaluate the IR spectrum. Provide a structure and note any important peaks corresponding to the structure. It was an experiment using: isoamyl alcohol + acetic acid sulfuric acid as the catalys...
 Please evaluate the IR spectrum. Provide a structure and note
any important peaks corresponding to the structure.
It was an experiment using:
isoamyl alcohol + acetic acid
sulfuric acid as the catalyst
and the products are isoamyl acetate and water. Thank you so
much!!!
95 卜诒 卜” 90 85 寸 80 75 70 65 E 60 ー 55 50 45 40 35 30 25 20 4000 3500 3000 2500 2000 Wavenumbers (cm-1) 1500 1000 500
95 卜诒 卜” 90 85...
Please evaluate the IR spectrum. Provide a structure and note
any important peaks corresponding to the structure.
It was an experiment using:
isoamyl alcohol + acetic acid
sulfuric acid as the catalyst
and the products are isoamyl acetate and water. Thank you so
much!!!
95 卜诒 卜” 90 85 寸 80 75 70 65 E 60 ー 55 50 45 40 35 30 25 20 4000 3500 3000 2500 2000 Wavenumbers (cm-1) 1500 1000 500
95 卜诒 卜” 90 85...
Can someone please help me interpret the IR spectrum of isoamyl alcohol? Thank you. Transmittance 3500...
 Can
someone please help me interpret the IR spectrum of isoamyl
alcohol? Thank you.
Transmittance 3500 ini dicohol 3305.41 3000 2955 20 2928.96 2870.83 2500 Wavenumbers (cm-1) 2000 1701.33 1685 24 1500 1654.58 1647.99 s o 1466.23 1384.65 1366.83 17 18.65 163727 1540 1169.36 1212.18 1124.24 1000 1056.64 1009.85 966.39 835.59 DOS
Can
someone please help me interpret the IR spectrum of isoamyl
alcohol? Thank you.
Transmittance 3500 ini dicohol 3305.41 3000 2955 20 2928.96 2870.83 2500 Wavenumbers (cm-1) 2000 1701.33 1685 24 1500 1654.58 1647.99 s o 1466.23 1384.65 1366.83 17 18.65 163727 1540 1169.36 1212.18 1124.24 1000 1056.64 1009.85 966.39 835.59 DOS
 IR
spectrum of Iodination of Salicylamide, what product was produced?
Please explain the peaks. There is a benzene ring stretch at
3080cm-1 but what else?
Please explain
IR
Spec of Iodination of Salicylamide. what product is produced? and
what peaks show it
% Transmittance Peak list Sensitivity Region Spectrum FIND PEAKS Absolute threshold: 97.749 50 4000.00 4000 3500 A JO 3000 3080? 2500 Wavenumbers (cm-1) 2000 1750.52 1608 1472 1295 4253 1253.10 115009103.24067 1000 995.69 955-87 919.90 777 842 54...
IR
spectrum of Iodination of Salicylamide, what product was produced?
Please explain the peaks. There is a benzene ring stretch at
3080cm-1 but what else?
Please explain
IR
Spec of Iodination of Salicylamide. what product is produced? and
what peaks show it
% Transmittance Peak list Sensitivity Region Spectrum FIND PEAKS Absolute threshold: 97.749 50 4000.00 4000 3500 A JO 3000 3080? 2500 Wavenumbers (cm-1) 2000 1750.52 1608 1472 1295 4253 1253.10 115009103.24067 1000 995.69 955-87 919.90 777 842 54...
 pls interpret and analyze both IR Spectrum . thanks
philip/johnson 105 100 95 90- 85 80 75 70 65 60 55 50- 45- 500 1000 1500 2000 2500 3500 3000 4000 Wavenumbers (om-1) %Transmittance 100 philipljphnson 95- 85 80 75 70- 65- 60 55 50 4000 3500 1000 500 3000 1500 2500 2000 %Transmittance 90
philip/johnson 105 100 95 90- 85 80 75 70 65 60 55 50- 45- 500 1000 1500 2000 2500 3500 3000 4000 Wavenumbers (om-1) %Transmittance...
pls interpret and analyze both IR Spectrum . thanks
philip/johnson 105 100 95 90- 85 80 75 70 65 60 55 50- 45- 500 1000 1500 2000 2500 3500 3000 4000 Wavenumbers (om-1) %Transmittance 100 philipljphnson 95- 85 80 75 70- 65- 60 55 50 4000 3500 1000 500 3000 1500 2500 2000 %Transmittance 90
philip/johnson 105 100 95 90- 85 80 75 70 65 60 55 50- 45- 500 1000 1500 2000 2500 3500 3000 4000 Wavenumbers (om-1) %Transmittance...
 Label all peaks of this IR spectrum. Please help
me.
3500 3000 2961.48 2869.66 2500 Wavenumbers (cm-1) 2000 1745.65 1500 1387.86 1368.87 1229.55 1000 500 Infrared Peak (cm) Structural Assignment
Label all peaks of this IR spectrum. Please help
me.
3500 3000 2961.48 2869.66 2500 Wavenumbers (cm-1) 2000 1745.65 1500 1387.86 1368.87 1229.55 1000 500 Infrared Peak (cm) Structural Assignment
 May someone help me label all peaks of this IR
spectrum.
3500 3000 2961.48 2869.66 2500 Wavenumbers (cm-1) 2000 1745.65 1500 1387.86 1368.87 1229.55 1000 500 Infrared Peak (cm) Structural Assignment
May someone help me label all peaks of this IR
spectrum.
3500 3000 2961.48 2869.66 2500 Wavenumbers (cm-1) 2000 1745.65 1500 1387.86 1368.87 1229.55 1000 500 Infrared Peak (cm) Structural Assignment
 1) Identify the functional group (alkane, alkene, ketone, aldehyde, aldehyde, etc) for the compounds providing the IR spectra: % Transmittance 4000 3500 3000 1500 1000 500 2500 2000 Wavenumber(cm) % Transmittance 4000 3500 3000 1500 1000 500 2500 2000 Wavenumber(cm) % Transmittance 1000 3500 3000 1500 1000 500 2500 2000 Wavenumber (cm)
 Interpret the IR spectrum. Assign peaks to the major
functional groups present in Compound 3.
%Transmittance 4000 451 3500 3000 2500 Wavenumbers (cm-1) 2000 1704.22 1582.94 1500 1455.74 1401.84 1360.52 1277.77 1199.79 1169,80 1000 1149.01 1090.22 1008 96 1024.98 COMPOUND 3 942.39 919 35 885.89 855.60 780.62 714.49
Interpret the IR spectrum. Assign peaks to the major
functional groups present in Compound 3.
%Transmittance 4000 451 3500 3000 2500 Wavenumbers (cm-1) 2000 1704.22 1582.94 1500 1455.74 1401.84 1360.52 1277.77 1199.79 1169,80 1000 1149.01 1090.22 1008 96 1024.98 COMPOUND 3 942.39 919 35 885.89 855.60 780.62 714.49
 interpet the peaks of the IR spectrum and each funtional group
present
289725 3419.06 29842356.39 333904 3224 25 1631.00 1516.20 1683.18 1592.73 1% 3500 3000 2500 2000 1500 1000 515 cm-1
interpet the peaks of the IR spectrum and each funtional group
present
289725 3419.06 29842356.39 333904 3224 25 1631.00 1516.20 1683.18 1592.73 1% 3500 3000 2500 2000 1500 1000 515 cm-1
 IR Worksheet 1. For each spectrum below: 1) Label the major peaks with their approximate frequency. 2) Identify the bond vibration and possible functional group associated with each peak. 3) Match the spectra to one of these possible compounds: NH2 TRANSMITTANCE[%] pobo edo "2060 bo zdoo 160 Tobo 560 WAVENUMBER [cm-1] oot 08 TRANSMITTANCE [%] 09 01 02 4000 3500 3000 2500 2000 WAVENUMBER (cm-1] 1500 1000 500 οοο TRANSMITTANCE (6) οο οο οε 4000 3500 3000 1500 1000 2500...
 Please evaluate the IR spectrum. Provide a structure and note
any important peaks corresponding to the structure.
It was an experiment using:
isoamyl alcohol + acetic acid
sulfuric acid as the catalyst
and the products are isoamyl acetate and water. Thank you so
much!!!
95 卜诒 卜” 90 85 寸 80 75 70 65 E 60 ー 55 50 45 40 35 30 25 20 4000 3500 3000 2500 2000 Wavenumbers (cm-1) 1500 1000 500
95 卜诒 卜” 90 85...
Please evaluate the IR spectrum. Provide a structure and note
any important peaks corresponding to the structure.
It was an experiment using:
isoamyl alcohol + acetic acid
sulfuric acid as the catalyst
and the products are isoamyl acetate and water. Thank you so
much!!!
95 卜诒 卜” 90 85 寸 80 75 70 65 E 60 ー 55 50 45 40 35 30 25 20 4000 3500 3000 2500 2000 Wavenumbers (cm-1) 1500 1000 500
95 卜诒 卜” 90 85...
 Can
someone please help me interpret the IR spectrum of isoamyl
alcohol? Thank you.
Transmittance 3500 ini dicohol 3305.41 3000 2955 20 2928.96 2870.83 2500 Wavenumbers (cm-1) 2000 1701.33 1685 24 1500 1654.58 1647.99 s o 1466.23 1384.65 1366.83 17 18.65 163727 1540 1169.36 1212.18 1124.24 1000 1056.64 1009.85 966.39 835.59 DOS
Can
someone please help me interpret the IR spectrum of isoamyl
alcohol? Thank you.
Transmittance 3500 ini dicohol 3305.41 3000 2955 20 2928.96 2870.83 2500 Wavenumbers (cm-1) 2000 1701.33 1685 24 1500 1654.58 1647.99 s o 1466.23 1384.65 1366.83 17 18.65 163727 1540 1169.36 1212.18 1124.24 1000 1056.64 1009.85 966.39 835.59 DOS
Most questions answered within 3 hours.
-
Determine the temperature (in Celsius) at which 1.00 mole of an
ideal gas will have a...
asked 3 minutes ago -
[1] Household statistics include individuals living alone or in
groups in:
A) apartments.
B) military barracks....
asked 6 minutes ago -
What is the % w/v when 80 mL of a 2.0% solution is mixed with 50...
asked 9 minutes ago -
How can I solve the following using a TI83
Claim: Most adults would erase all of...
asked 22 minutes ago -
Analysis of 3-ethyl-3-buten-2-ol gave C, 72.13%; H, 11.92%.
Calculate the percent deviation of these results from...
asked 19 minutes ago -
Which VALS segment is most likely to have a top of the line
brand new (2015)...
asked 23 minutes ago -
Write a program to score the paper-rock-scissor game. Each of
two users types in either P,R...
asked 43 minutes ago -
Calculate the equillibrium constent K for a redox reaction that
has E°cell = -.98 V at...
asked 55 minutes ago -
A concave spherical mirror has a radius of curvature of
magnitude 19.6 cm.
(a) Find the...
asked 57 minutes ago -
3. draw a diagram of the magnetic field:
a. around a long straight wire with a...
asked 55 minutes ago -
If you titrated 30.0 mL of 0.1 M HCl with 0.1 M NaOH, indicate
the approximate...
asked 1 hour ago -
NADH passes electrons into the electron transport chain. List
the carriers that would receive the electrons,...
asked 1 hour ago