
Homework Answers
Add Answer to:
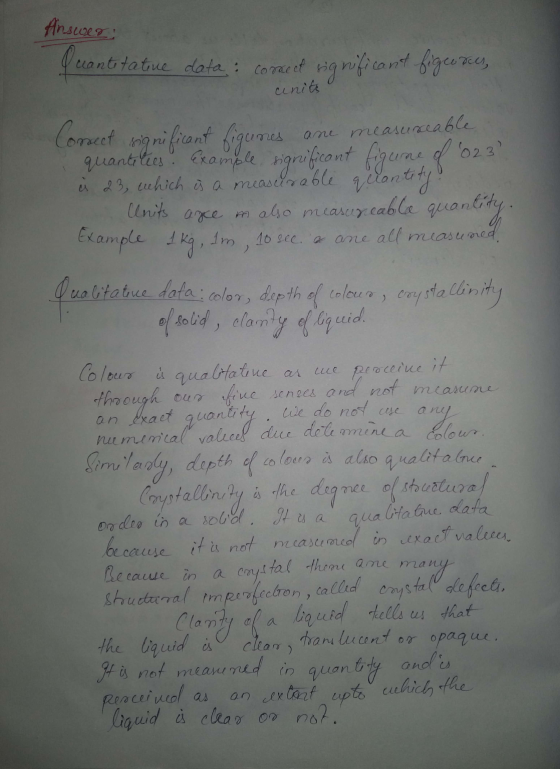
Classify the items listed as aspects of quantitative or qualitative experimental data. Quantitative data Qualitative data...
A researcher obtained the following observations. Classify each resulting data as quantitative or qualitative. X1: The...
A researcher obtained the following observations. Classify each resulting data as quantitative or qualitative. X1: The number of books read by high school students during the academic year. X2: The weight of high school students. X3: Types computer used by middle school students (Mac v.s. PC). Group of answer choices X1: quantitative, X2: quantitative, X3:Quantitative X1: qualitative, X2: quantitative, X3:qualitative X1: quantitative, X2: quantitative, X3:qualitative X1: qualitative, X2: quantitative, X3:quantitative
415 > Classify each observation about a patient in the hospital as either qualitative or quantitative....
 415 > Classify each observation about a patient in the hospital as either qualitative or quantitative. Qualitative Quantitative Answer Bank pulse is normal temperature is 100.2 °C urine specific density is 1.02 g/mL. blood sugar level is 150 mg/dL. face is very pale blood pressure is high
Classify the following data. Indicate whether the data is qualitative or quantitative, indicate whether the data...
Classify the following data. Indicate whether the data is qualitative or quantitative, indicate whether the data is discrete, continuous, or neither, and indicate the level of measurement for the data. A survey response to "Do you favor a flat tax?" 1) Yes 2) No 1. Are these data qualitative or quantitative? 2. Are these data discrete, continuous or neither? 3. What is the highest level of measurement the data possesses? Nominal, ordinal, interval, or ratio?
Classify the variables A to F as qualitative or quantitative. For quantitative data, please state whether...
Classify the variables A to F as qualitative or quantitative. For quantitative data, please state whether the variable is discrete or continuous. Then, for each one, distinguish between the four (4) levels of measurement (nominal, ordinal, interval and ratio). What is your Year of Graduation (YOG)? How many courses are you enrolled in? What method of payment do you use to pay for textbooks? Cash Credit Card Debit Card
Classify the variables A to F as qualitative or quantitative. For quantitative data, please state whether...
Classify the variables A to F as qualitative or quantitative. For quantitative data, please state whether the variable is discrete or continuous. Then, for each one, distinguish between the four (4) levels of measurement (nominal, ordinal, interval and ratio). What is the total cost of textbooks for your courses? How many times do you see your Academic Advisor during the semester? How do you rate the Add/Drop period? Very good/ Good/ Bad
Question 1. Classify the attributes from the following aspects: (1) binary, discrete, or continuous. (2) qualitative...
Question 1. Classify the attributes from the following aspects: (1) binary, discrete, or continuous. (2) qualitative or quantitative. (3) nominal, ordinal, interval, or ratio. Example: Age in years. Answer: Discrete, quantitative, ratio. a. Weight in kg. b. ISBN of a book c. Letter grades: A, B, C, D, F d. Blood type of patient: Type A, Type B, Type O, Type AB, etc.
Explain the difference between qualitative and quantitative data. Choose the correct answer below O A. Quantitative...
 Explain the difference between qualitative and quantitative data. Choose the correct answer below O A. Quantitative data are categorical in nature, while qualitative data are numerical in nature. O B. Quantitative data are collected from a designed experiment, while qualitative data are from an observational study. ° C. Quantitative data are data from a population, while qualitative data are data from a sample O D. Quantitative data are data from a sample, while qualitative data are data from a population....
dentify the type of data (qualitative/quantitative) and the level of measurement for the data described below....
 dentify the type of data (qualitative/quantitative) and the level of measurement for the data described below. Explain your choice. Student Student 1 Student 2 Student 3 Student 4 Student 5 GPA 4.0 3.85 3.4 3.1 2.6 A history professor is known as a tough grader. The grade point average (GPA) for five students is shown in the table to the right. Are the data qualitative or quantitative? O A. Qualitative, because descriptive terms are used to measure or classify the...
Determine whether the data described below are qualitative or quantitative and explain why. The styles of...
Determine whether the data described below are qualitative or quantitative and explain why. The styles of shoes of clients entering a certain store left parenthesis sneaker comma boot comma sandal comma etc. right parenthesis Choose the correct answer below. A. The data are qualitative because they consist of counts or measurements. B. The data are quantitative because they don't measure or count anything. C. The data are quantitative because they consist of counts or measurements. D. The data are qualitative...
Lab Partneris) EXPERIMENT1 Experimental Uncertainty (Error) and Data Analysis TI Laboratory Report 1. Significant Figures (a)...
 Lab Partneris) EXPERIMENT1 Experimental Uncertainty (Error) and Data Analysis TI Laboratory Report 1. Significant Figures (a) Express the numbers listed in Data Table 1 to three significant figures, writing the numbers in the first column in normal notation and the numbers in the second column in powers-of-10 (scientific) notation. DATA TABLE1 Purpose: To practice expressing significant figures. 280 528 x0 0.524 15.08 1444 0.0254 83,909 0.060 82.453 000010 2,700,000,000 (b) A rectangular block of wood is measured to have the...
 415 > Classify each observation about a patient in the hospital as either qualitative or quantitative. Qualitative Quantitative Answer Bank pulse is normal temperature is 100.2 °C urine specific density is 1.02 g/mL. blood sugar level is 150 mg/dL. face is very pale blood pressure is high
 Explain the difference between qualitative and quantitative data. Choose the correct answer below O A. Quantitative data are categorical in nature, while qualitative data are numerical in nature. O B. Quantitative data are collected from a designed experiment, while qualitative data are from an observational study. ° C. Quantitative data are data from a population, while qualitative data are data from a sample O D. Quantitative data are data from a sample, while qualitative data are data from a population....
 dentify the type of data (qualitative/quantitative) and the level of measurement for the data described below. Explain your choice. Student Student 1 Student 2 Student 3 Student 4 Student 5 GPA 4.0 3.85 3.4 3.1 2.6 A history professor is known as a tough grader. The grade point average (GPA) for five students is shown in the table to the right. Are the data qualitative or quantitative? O A. Qualitative, because descriptive terms are used to measure or classify the...
 Lab Partneris) EXPERIMENT1 Experimental Uncertainty (Error) and Data Analysis TI Laboratory Report 1. Significant Figures (a) Express the numbers listed in Data Table 1 to three significant figures, writing the numbers in the first column in normal notation and the numbers in the second column in powers-of-10 (scientific) notation. DATA TABLE1 Purpose: To practice expressing significant figures. 280 528 x0 0.524 15.08 1444 0.0254 83,909 0.060 82.453 000010 2,700,000,000 (b) A rectangular block of wood is measured to have the...
Most questions answered within 3 hours.
-
han discusses the racist practice of badlands, a bar
in the Castro
district of San Francisco,...
asked 2 minutes ago -
A sample of final exam scores is normally distributed with a
mean equal to 25 and...
asked 6 minutes ago -
An investor shorts 100 shares of a stock when the share price is
$50 and closes...
asked 10 minutes ago -
LLOP corporation just paid 4$ dividend per share, you expect the
dividend to grow 8% for...
asked 19 minutes ago -
if we subtract 1000 from 0001 is there overflow? (binary)
asked 27 minutes ago -
Hello, I need help with the function below, The language I am
using is Ocaml
open...
asked 28 minutes ago -
Explain how the presence of glucose represses the gal structural
genes?
asked 36 minutes ago -
For the reaction CaI2+2AgNO3⟶2AgI+Ca(NO3)2 how many grams of
silver iodide, AgI, are produced from 56.5 g...
asked 48 minutes ago -
Write an equation for hydrolysis via acid catalysis.
Using ethyl acetate, ethyl benzoate, ethyl formate or...
asked 55 minutes ago -
Only one graph is needed.
(a) Draw a Supply Curve and the Demand Curve for the...
asked 59 minutes ago -
Fill in the blanks and please show how you arrived at numerical
answers
. The...
asked 59 minutes ago -
91. If the half – life of a sample of radioactive
material is 60 days, what...
asked 1 hour ago