


Homework Answers

Add Answer to:
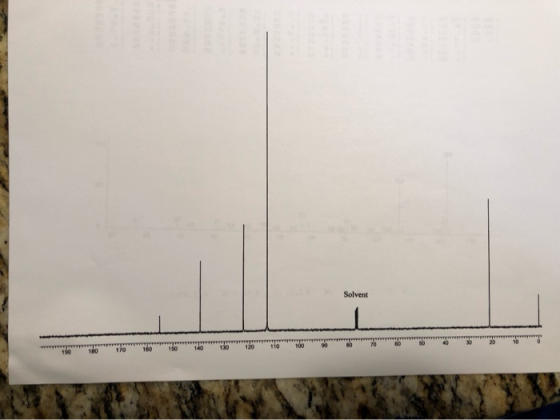
please help me determine my unknown
my empirical and molecular formula is C8H10O
my melting point...
1. Based on the elemental analysis for the unknown organic compound, calculate the empirical formula. If...
 1. Based on the elemental analysis for the unknown
organic compound, calculate the empirical formula. If compound
contains an unknown element (X), briefly explain how you identified
which element it is.
2. Determine molecular formula for unknown compound and explain
answer.
3. Based on molecular formulary, calculate degree of saturation
present in unknown organic compound.
4. Clearly label molecular ion peak and base peak directly on the
mass spectrum and draw structures corresponding to these
icons.
5. identify at least...
1. Based on the elemental analysis for the unknown
organic compound, calculate the empirical formula. If compound
contains an unknown element (X), briefly explain how you identified
which element it is.
2. Determine molecular formula for unknown compound and explain
answer.
3. Based on molecular formulary, calculate degree of saturation
present in unknown organic compound.
4. Clearly label molecular ion peak and base peak directly on the
mass spectrum and draw structures corresponding to these
icons.
5. identify at least...
Consider the below matrixA, which you can copy and paste directly into Matlab.
Problem #1: Consider the below matrix A, which you can copy and paste directly into Matlab. The matrix contains 3 columns. The first column consists of Test #1 marks, the second column is Test # 2 marks, and the third column is final exam marks for a large linear algebra course. Each row represents a particular student.A = [36 45 75 81 59 73 77 73 73 65 72 78 65 55 83 73 57 78 84 31 60 83...
1. Forecast demand for Year 4. a. Explain what technique you utilized to forecast your demand....
 1. Forecast demand for Year 4.
a. Explain what technique you utilized to forecast your
demand.
b. Explain why you chose this technique over others.
Year 3 Year 1 Year 2 Actual Actual Actual Forecast Forecast Forecast Demand Demand Demand Week 1 52 57 63 55 66 77 Week 2 49 58 68 69 75 65 Week 3 47 50 58 65 80 74 Week 4 60 53 58 55 78 67 57 Week 5 49 57 64 76 77...
1. Forecast demand for Year 4.
a. Explain what technique you utilized to forecast your
demand.
b. Explain why you chose this technique over others.
Year 3 Year 1 Year 2 Actual Actual Actual Forecast Forecast Forecast Demand Demand Demand Week 1 52 57 63 55 66 77 Week 2 49 58 68 69 75 65 Week 3 47 50 58 65 80 74 Week 4 60 53 58 55 78 67 57 Week 5 49 57 64 76 77...
can i please get help on identifying my unknown and answering the questions for each part....
 can
i please get help on identifying my unknown and answering the
questions for each part. and please explain because i will be given
an exam like this and want to really understand.
n 122240 2019 (GMT-04 00h 94 92 90 88 86 84 82 80 78 76 74 72 70 68 66 64 1000 1500 2000 2500 3000 3500 4000 Wavenumbers (cm-1) Date: Tue Jun 11 12:22:40 2019 (GMT-04:00kaoutar elbar Scans: 8 Resolution: 4.000 onemea1% RH 003 Q1L 129...
can
i please get help on identifying my unknown and answering the
questions for each part. and please explain because i will be given
an exam like this and want to really understand.
n 122240 2019 (GMT-04 00h 94 92 90 88 86 84 82 80 78 76 74 72 70 68 66 64 1000 1500 2000 2500 3000 3500 4000 Wavenumbers (cm-1) Date: Tue Jun 11 12:22:40 2019 (GMT-04:00kaoutar elbar Scans: 8 Resolution: 4.000 onemea1% RH 003 Q1L 129...
Please show how you did this in excel. :13-19 Every home football game for the past...
 Please show how you did this in excel.
:13-19 Every home football game for the past eight years at Eastern State University has been sold out. The revenues from ticket sales are significant, but the sale of food, beverages, and souvenirs has contrib- uted greatly to the overall profitability of the football program. One particular souvenir is the football pro- gram for each game. The number of programs sold at each game is described by the following probabil- ity distribution:...
Please show how you did this in excel.
:13-19 Every home football game for the past eight years at Eastern State University has been sold out. The revenues from ticket sales are significant, but the sale of food, beverages, and souvenirs has contrib- uted greatly to the overall profitability of the football program. One particular souvenir is the football pro- gram for each game. The number of programs sold at each game is described by the following probabil- ity distribution:...
Please help me identify and interpret this Chalcone IR Spectra. The melting point was found to...
 Please help me identify and interpret this Chalcone IR
Spectra. The melting point was found to be at 125 degrees
celsius.
4000 3500 3000 2500 2000 1500 1000 Wavenumbers (om-1) Fri May 03 13:4202 2019 (GMT-07:00) FIND PEAKS 400.00 Absolute threshold: 89.377 50 Peak list Position: 403.50Intensity. 72.864 Position: 425.70 Intensity 79.141 Position: 442.21 Intensity 82.163 Position: 449.68 Intensity 81.818 Position: 467.14 Intensity 68.360 Position: 491.67 Intensity 70.269 Position: 509.20 Intensity. 70.080 Position525.95 Intensity 75.729 Position: 535.53 Intensity 73.518 Position:...
Please help me identify and interpret this Chalcone IR
Spectra. The melting point was found to be at 125 degrees
celsius.
4000 3500 3000 2500 2000 1500 1000 Wavenumbers (om-1) Fri May 03 13:4202 2019 (GMT-07:00) FIND PEAKS 400.00 Absolute threshold: 89.377 50 Peak list Position: 403.50Intensity. 72.864 Position: 425.70 Intensity 79.141 Position: 442.21 Intensity 82.163 Position: 449.68 Intensity 81.818 Position: 467.14 Intensity 68.360 Position: 491.67 Intensity 70.269 Position: 509.20 Intensity. 70.080 Position525.95 Intensity 75.729 Position: 535.53 Intensity 73.518 Position:...
I conducted a project and my intermediate is supposed to be Acetanilide. I took the IR...
 I conducted a project and my intermediate is supposed to be
Acetanilide. I took the IR and the H NMR and need help determing
peaks that are consistant with Acetanilide. or if there are peaks
that are inconsistant.
3058 803 3290.95 1080 36 838.51 3134.89 %Transmittance 1012 20 90627 95124 1683.02 1485.45 1365.88 1178.96 - 163528 1432 52 1260 82 1595.75 149828 1318,37 50591 532 35 863.63 545 17 62601 99791 749.54 62 269 _29 219 4000 3500 2500 2000...
I conducted a project and my intermediate is supposed to be
Acetanilide. I took the IR and the H NMR and need help determing
peaks that are consistant with Acetanilide. or if there are peaks
that are inconsistant.
3058 803 3290.95 1080 36 838.51 3134.89 %Transmittance 1012 20 90627 95124 1683.02 1485.45 1365.88 1178.96 - 163528 1432 52 1260 82 1595.75 149828 1318,37 50591 532 35 863.63 545 17 62601 99791 749.54 62 269 _29 219 4000 3500 2500 2000...
RANGES FREQUENCY RELATIVE FREQUENCY CUMULATIVE REL. FREQ. 1 - 10 11 - 20 21 - 30 31 - 40...
 RANGES
FREQUENCY
RELATIVE FREQUENCY
CUMULATIVE REL. FREQ.
1 - 10
11 - 20
21 - 30
31 - 40
41 - 50
51 - 60
61 - 70
71 - 80
81 - 90
91 - 100
'= 100 DATA
VALUES??
SO, WHAT DOES A FREQUENCY TABLE TELL US?
If
you wrote each of the above data values on a ping pong ball,, put
them in a jar and blindly pulled one out:
What is the probability that this ball...
RANGES
FREQUENCY
RELATIVE FREQUENCY
CUMULATIVE REL. FREQ.
1 - 10
11 - 20
21 - 30
31 - 40
41 - 50
51 - 60
61 - 70
71 - 80
81 - 90
91 - 100
'= 100 DATA
VALUES??
SO, WHAT DOES A FREQUENCY TABLE TELL US?
If
you wrote each of the above data values on a ping pong ball,, put
them in a jar and blindly pulled one out:
What is the probability that this ball...
Trying to verify my answers and R code. Please help!!! The State of Florida has decided to use a factorial design to compare five high schools offering Inter- national Baccalaureate programs with reg...
 Trying to verify my answers and R code. Please help!!!
The State of Florida has decided to use a factorial design to compare five high schools offering Inter- national Baccalaureate programs with regard to how well the students are doing on a standardized test. Four courses are examined, each with three years of data. The data is as follows, Courses High School IV 48, 44, 46 62, 66, 64 54, 46, 50 57, 53, 55 53, 47, 50 70, 66,...
Trying to verify my answers and R code. Please help!!!
The State of Florida has decided to use a factorial design to compare five high schools offering Inter- national Baccalaureate programs with regard to how well the students are doing on a standardized test. Four courses are examined, each with three years of data. The data is as follows, Courses High School IV 48, 44, 46 62, 66, 64 54, 46, 50 57, 53, 55 53, 47, 50 70, 66,...
2 62.8 MEAN = 3 71.9 MEDIAN = 4 69.6 MODE= 5 74.1 RANGE = 6 66.6 MIN. = 7 76.5 MAX.= 8 66.4 STDEV. = 9 73.1 MY HEIGHT =67.00 10 71.6 Z SCORE FOR MY HEIGHT = 11 69.3 12 64.0 13...
2 62.8 MEAN = 3 71.9 MEDIAN = 4 69.6 MODE= 5 74.1 RANGE = 6 66.6 MIN. = 7 76.5 MAX.= 8 66.4 STDEV. = 9 73.1 MY HEIGHT =67.00 10 71.6 Z SCORE FOR MY HEIGHT = 11 69.3 12 64.0 13 70.9 14 62.2 15 63.3 16 67.7 17 65.2 18 64.2 19 69.4 20 71.7 21 64.6 22 69.0 23 71.3 24 69.1 25 71.6 26 75.9 27 66.2 28 67.4 29 64.6 30 69.6 31...
 1. Based on the elemental analysis for the unknown
organic compound, calculate the empirical formula. If compound
contains an unknown element (X), briefly explain how you identified
which element it is.
2. Determine molecular formula for unknown compound and explain
answer.
3. Based on molecular formulary, calculate degree of saturation
present in unknown organic compound.
4. Clearly label molecular ion peak and base peak directly on the
mass spectrum and draw structures corresponding to these
icons.
5. identify at least...
1. Based on the elemental analysis for the unknown
organic compound, calculate the empirical formula. If compound
contains an unknown element (X), briefly explain how you identified
which element it is.
2. Determine molecular formula for unknown compound and explain
answer.
3. Based on molecular formulary, calculate degree of saturation
present in unknown organic compound.
4. Clearly label molecular ion peak and base peak directly on the
mass spectrum and draw structures corresponding to these
icons.
5. identify at least...
 1. Forecast demand for Year 4.
a. Explain what technique you utilized to forecast your
demand.
b. Explain why you chose this technique over others.
Year 3 Year 1 Year 2 Actual Actual Actual Forecast Forecast Forecast Demand Demand Demand Week 1 52 57 63 55 66 77 Week 2 49 58 68 69 75 65 Week 3 47 50 58 65 80 74 Week 4 60 53 58 55 78 67 57 Week 5 49 57 64 76 77...
1. Forecast demand for Year 4.
a. Explain what technique you utilized to forecast your
demand.
b. Explain why you chose this technique over others.
Year 3 Year 1 Year 2 Actual Actual Actual Forecast Forecast Forecast Demand Demand Demand Week 1 52 57 63 55 66 77 Week 2 49 58 68 69 75 65 Week 3 47 50 58 65 80 74 Week 4 60 53 58 55 78 67 57 Week 5 49 57 64 76 77...
 can
i please get help on identifying my unknown and answering the
questions for each part. and please explain because i will be given
an exam like this and want to really understand.
n 122240 2019 (GMT-04 00h 94 92 90 88 86 84 82 80 78 76 74 72 70 68 66 64 1000 1500 2000 2500 3000 3500 4000 Wavenumbers (cm-1) Date: Tue Jun 11 12:22:40 2019 (GMT-04:00kaoutar elbar Scans: 8 Resolution: 4.000 onemea1% RH 003 Q1L 129...
can
i please get help on identifying my unknown and answering the
questions for each part. and please explain because i will be given
an exam like this and want to really understand.
n 122240 2019 (GMT-04 00h 94 92 90 88 86 84 82 80 78 76 74 72 70 68 66 64 1000 1500 2000 2500 3000 3500 4000 Wavenumbers (cm-1) Date: Tue Jun 11 12:22:40 2019 (GMT-04:00kaoutar elbar Scans: 8 Resolution: 4.000 onemea1% RH 003 Q1L 129...
 Please show how you did this in excel.
:13-19 Every home football game for the past eight years at Eastern State University has been sold out. The revenues from ticket sales are significant, but the sale of food, beverages, and souvenirs has contrib- uted greatly to the overall profitability of the football program. One particular souvenir is the football pro- gram for each game. The number of programs sold at each game is described by the following probabil- ity distribution:...
Please show how you did this in excel.
:13-19 Every home football game for the past eight years at Eastern State University has been sold out. The revenues from ticket sales are significant, but the sale of food, beverages, and souvenirs has contrib- uted greatly to the overall profitability of the football program. One particular souvenir is the football pro- gram for each game. The number of programs sold at each game is described by the following probabil- ity distribution:...
 Please help me identify and interpret this Chalcone IR
Spectra. The melting point was found to be at 125 degrees
celsius.
4000 3500 3000 2500 2000 1500 1000 Wavenumbers (om-1) Fri May 03 13:4202 2019 (GMT-07:00) FIND PEAKS 400.00 Absolute threshold: 89.377 50 Peak list Position: 403.50Intensity. 72.864 Position: 425.70 Intensity 79.141 Position: 442.21 Intensity 82.163 Position: 449.68 Intensity 81.818 Position: 467.14 Intensity 68.360 Position: 491.67 Intensity 70.269 Position: 509.20 Intensity. 70.080 Position525.95 Intensity 75.729 Position: 535.53 Intensity 73.518 Position:...
Please help me identify and interpret this Chalcone IR
Spectra. The melting point was found to be at 125 degrees
celsius.
4000 3500 3000 2500 2000 1500 1000 Wavenumbers (om-1) Fri May 03 13:4202 2019 (GMT-07:00) FIND PEAKS 400.00 Absolute threshold: 89.377 50 Peak list Position: 403.50Intensity. 72.864 Position: 425.70 Intensity 79.141 Position: 442.21 Intensity 82.163 Position: 449.68 Intensity 81.818 Position: 467.14 Intensity 68.360 Position: 491.67 Intensity 70.269 Position: 509.20 Intensity. 70.080 Position525.95 Intensity 75.729 Position: 535.53 Intensity 73.518 Position:...
 I conducted a project and my intermediate is supposed to be
Acetanilide. I took the IR and the H NMR and need help determing
peaks that are consistant with Acetanilide. or if there are peaks
that are inconsistant.
3058 803 3290.95 1080 36 838.51 3134.89 %Transmittance 1012 20 90627 95124 1683.02 1485.45 1365.88 1178.96 - 163528 1432 52 1260 82 1595.75 149828 1318,37 50591 532 35 863.63 545 17 62601 99791 749.54 62 269 _29 219 4000 3500 2500 2000...
I conducted a project and my intermediate is supposed to be
Acetanilide. I took the IR and the H NMR and need help determing
peaks that are consistant with Acetanilide. or if there are peaks
that are inconsistant.
3058 803 3290.95 1080 36 838.51 3134.89 %Transmittance 1012 20 90627 95124 1683.02 1485.45 1365.88 1178.96 - 163528 1432 52 1260 82 1595.75 149828 1318,37 50591 532 35 863.63 545 17 62601 99791 749.54 62 269 _29 219 4000 3500 2500 2000...
 RANGES
FREQUENCY
RELATIVE FREQUENCY
CUMULATIVE REL. FREQ.
1 - 10
11 - 20
21 - 30
31 - 40
41 - 50
51 - 60
61 - 70
71 - 80
81 - 90
91 - 100
'= 100 DATA
VALUES??
SO, WHAT DOES A FREQUENCY TABLE TELL US?
If
you wrote each of the above data values on a ping pong ball,, put
them in a jar and blindly pulled one out:
What is the probability that this ball...
RANGES
FREQUENCY
RELATIVE FREQUENCY
CUMULATIVE REL. FREQ.
1 - 10
11 - 20
21 - 30
31 - 40
41 - 50
51 - 60
61 - 70
71 - 80
81 - 90
91 - 100
'= 100 DATA
VALUES??
SO, WHAT DOES A FREQUENCY TABLE TELL US?
If
you wrote each of the above data values on a ping pong ball,, put
them in a jar and blindly pulled one out:
What is the probability that this ball...
 Trying to verify my answers and R code. Please help!!!
The State of Florida has decided to use a factorial design to compare five high schools offering Inter- national Baccalaureate programs with regard to how well the students are doing on a standardized test. Four courses are examined, each with three years of data. The data is as follows, Courses High School IV 48, 44, 46 62, 66, 64 54, 46, 50 57, 53, 55 53, 47, 50 70, 66,...
Trying to verify my answers and R code. Please help!!!
The State of Florida has decided to use a factorial design to compare five high schools offering Inter- national Baccalaureate programs with regard to how well the students are doing on a standardized test. Four courses are examined, each with three years of data. The data is as follows, Courses High School IV 48, 44, 46 62, 66, 64 54, 46, 50 57, 53, 55 53, 47, 50 70, 66,...
Most questions answered within 3 hours.
-
In 1970s and 1980s, molecular biologists discovered that the
hormone testosterone, binds a receptor protein that...
asked 1 hour ago -
january 1 2010 road catering service purchase a piece of
equipment for 58000 which is expected...
asked 1 hour ago -
Explain Mertons concept of anomie is and what the
modes of adaptation to it are?
asked 2 hours ago -
Jamie is doing a survey at her school about whether the students
feel the cafeteria food...
asked 3 hours ago -
How many liters of 0.669 M KOH will be needed to raise the pH of
0.339...
asked 6 hours ago -
A liquid of density 1270 kg/m 3 flows steadily through a pipe of
varying diameter and...
asked 6 hours ago -
Questions: What should the American executive do?
'A visiting American executive finds that a foreign subsidiary...
asked 6 hours ago -
Activity based costing was introduced as an alternative to
absorption costing.
1. Discuss using illustration the...
asked 6 hours ago -
1. You own shares of Crane DVD Company and are interested in
selling them. With so...
asked 6 hours ago -
How many grams of He are necessary to fill a balloon having a
volume of 4.5E3...
asked 6 hours ago -
The 2 patients, still in the hospital, were interviewed by a
MoH epidemiologist. The interviews revealed...
asked 6 hours ago -
An uncharged capacitor and a resistor are connected in series to
a source of emf. If...
asked 6 hours ago