
Homework Answers
Answer:
data is,

As,
k = A exp(-Ea/RT)
where k = rate constant
A = frequency factor
Ea = activation energy
R = gas constant = 8.314 J/K-mol
T = temperature
so
ln(k) = A - (Ea/RT)
So slope of ln(k) vs 1/T is -Ea/R
so plot is,
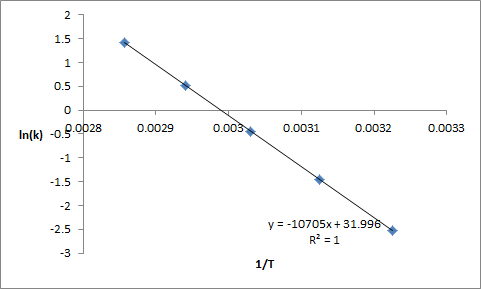
Here slope = -10705 = -Ea/R
Ea = 10705 x R = 10705 x 8.314 J/mol = 89001.37 J/mol = 89.001 kJ/mol = Ea
S activation energy of reation is,
Ea = 89.001 kJ/mol
From above,
ln A = intercept of line = 31.996
A = exp (31.996) = 7.86 x 10¹³
So
frequency factor = 7.86 x 10¹³
Add Answer to:
HIR The following data show the rate constant of a reaction measured at several different temperatures....
The following data show the rate constant of a reaction measured at several different temperatures. Temperature...
The following data show the rate constant of a reaction measured at several different temperatures. Temperature (K) Rate Constant (1/s) 310 4.54×10⁻² 320 0.136 330 0.381 340 1.01 350 2.51 Part A Use an Arrhenius plot to determine the activation barrier for the reaction. Express your answer using three significant figures. Part B Use an Arrhenius plot to determine the frequency factor for the reaction. Express your answer using two significant figures.
The following data show the rate constant of a reaction measured at several different temperatures. Temperature...
The following data show the rate constant of a reaction measured at several different temperatures. Temperature (K)(K) Rate Constant (1/s)(1/s) 310 0.923 320 2.50 330 6.38 340 15.4 350 35.3 Part A Use an Arrhenius plot to determine the activation barrier for the reaction. Express your answer using three significant figures. Part B Use an Arrhenius plot to determine the frequency factor for the reaction. Express your answer using two significant figures.
The following data show the rate constant of a reaction measured at several different temperatures. Temperature...
The following data show the rate constant of a reaction measured at several different temperatures. Temperature (K) Rate Constant (1/s) 300 1.19×10⁻² 310 3.64×10⁻² 320 0.104 330 0.278 340 0.703 Part A Part complete Use an Arrhenius plot to determine the activation barrier for the reaction. Express your answer using three significant figures. -- SubmitPrevious AnswersRequest Answer Part B Part complete Use an Arrhenius plot to determine frequency factor for the reaction. Express your answer using two significant figures. --...
14.5 The Effect of Temperature on Reaction Rate The following data show the rate constant of...
14.5 The Effect of Temperature on Reaction Rate The following data show the rate constant of a reaction measured at several different temperatures. Temperature (K) Rate Constant (1/s) 310 0.813 320 2.21 330 5.66 340 13.7 350 31.5 Question 10A: Use an Arrhenius plot to determine the activation barrier for the reaction. Express your answer using three significant figures. Answer in kJ/mol Question 10B: Use an Arrhenius plot to determine the frequency factor for the reaction. Express your answer using...
You may want to reference (Pages 606- 612) Section 14.6 while completing this problem. The following...
 You may want to reference (Pages 606- 612) Section 14.6 while completing this problem. The following data show the rate constant of a reaction measured at several different temperatures PartA Temperature (K) Rate constant (1/s) 300 310 320 330 340 1.61x10⁻² 4.90x10⁻² 0.139 0.370 0.931 Use an Arrhenius plot to determine the activation barrier (Ea) for the reaction Express your answer using three significant figures. kJ/mol Submit Part B Use an Arrhenius plot to determine the frequency factor (A) for...
Arrhenius plot to determine the activation
The following data show the rate constant of a reaction measured at several different temperatures.Temperature (K) Rate Constant (1/s)300 4.04×10^-2310 0.121320 0.340330 0.895340 2.23Use an Arrhenius plot to determine the activation barrier for the reaction.
Exercise 14.66 Part A Constants Periodic. Table Use an Arrhenius plot to determine the activation barrier...
 Exercise 14.66 Part A Constants Periodic. Table Use an Arrhenius plot to determine the activation barrier for the reaction. Express your answer using three significant figures. data show the rate constant of a reaction 9.58x10² 0.278 0.757 ??? 310 kJ/mol 4.69 Previous Answers Request Answer Incorrect; Try Again; 3 attempts remaining Part B Use an Arrhenius plot to determine frequency factor for the reaction. Express your answer using two significant figures. Submit Request Answer
The rate constant k for a certain reaction is measured at two different temperatures: temperature 148.0°C...
 The rate constant k for a certain reaction is measured at two different temperatures: temperature 148.0°C 78.0°C k 9.7x10? 9.4 x 10° Assuming the rate constant obeys the Arrhenius equation, calculate the activation energy E for this reaction. Round your answer to 2 significant digits. 9.- Omol
The rate constant k for a certain reaction is measured at two different temperatures: temperature 397.0°C...
 The rate constant k for a certain reaction is measured at two different temperatures: temperature 397.0°C 280.0°C k 1.1 x 10¹⁰ 1.3 x 10° Assuming the rate constant obeys the Arrhenius equation, calculate the activation energy for this reaction. Round your answer to 2 significant digits. 0.
Constants Periodic Ta The rate constant (k) for a reaction was measured as a function of...
 Constants Periodic Ta The rate constant (k) for a reaction was measured as a function of temperature. A plot of In k versus 1/T (in K) is linear and has a slope of -6265 K. Part A Calculate the activation energy for the reaction. Express your answer to four significant figures and include the appropriate units. НА ? E- Value Units Submit Request Answer
 You may want to reference (Pages 606- 612) Section 14.6 while completing this problem. The following data show the rate constant of a reaction measured at several different temperatures PartA Temperature (K) Rate constant (1/s) 300 310 320 330 340 1.61x10⁻² 4.90x10⁻² 0.139 0.370 0.931 Use an Arrhenius plot to determine the activation barrier (Ea) for the reaction Express your answer using three significant figures. kJ/mol Submit Part B Use an Arrhenius plot to determine the frequency factor (A) for...
 Exercise 14.66 Part A Constants Periodic. Table Use an Arrhenius plot to determine the activation barrier for the reaction. Express your answer using three significant figures. data show the rate constant of a reaction 9.58x10² 0.278 0.757 ??? 310 kJ/mol 4.69 Previous Answers Request Answer Incorrect; Try Again; 3 attempts remaining Part B Use an Arrhenius plot to determine frequency factor for the reaction. Express your answer using two significant figures. Submit Request Answer
 The rate constant k for a certain reaction is measured at two different temperatures: temperature 148.0°C 78.0°C k 9.7x10? 9.4 x 10° Assuming the rate constant obeys the Arrhenius equation, calculate the activation energy E for this reaction. Round your answer to 2 significant digits. 9.- Omol
 The rate constant k for a certain reaction is measured at two different temperatures: temperature 397.0°C 280.0°C k 1.1 x 10¹⁰ 1.3 x 10° Assuming the rate constant obeys the Arrhenius equation, calculate the activation energy for this reaction. Round your answer to 2 significant digits. 0.
 Constants Periodic Ta The rate constant (k) for a reaction was measured as a function of temperature. A plot of In k versus 1/T (in K) is linear and has a slope of -6265 K. Part A Calculate the activation energy for the reaction. Express your answer to four significant figures and include the appropriate units. НА ? E- Value Units Submit Request Answer
Most questions answered within 3 hours.
-
True or False: If some system undergoes a reversible,
isothermal
process, then its entropy must remain...
asked 24 minutes ago -
You are analyzing the after-tax cost of debt for a firm. You
know that the firm’s...
asked 21 minutes ago -
You
are dining with a friend and use the friend's spoon to taste her
food, if...
asked 46 minutes ago -
explain why The elasticity of demand for labor is higher the
higher the elasticity of supply...
asked 55 minutes ago -
The amount of time it takes for a student to complete a
statistics quiz is uniformly...
asked 52 minutes ago -
Hi just need to know if these statements are true or false and
why!!!
1. Magnetic...
asked 1 hour ago -
A radar transmits a pulse every 0.5
ms. It transmits an up-chirp of the duration of...
asked 1 hour ago -
Poehling Medical Center has a single operating room that is used
by local physicians to perform...
asked 1 hour ago -
Can somebody solve this? Insert 22, 78, 10, 56, 12, 7, 34, 56
into the Min-...
asked 1 hour ago -
Need a recent news article that was published less than 3 months
ago that talks about...
asked 1 hour ago -
Problem 2:
Composite and multi-valued attributes can be nested to any
number of levels. Suppose we...
asked 1 hour ago -
Use this information to answer the question.
Population of the City of Eldorado on Jan 1st...
asked 1 hour ago