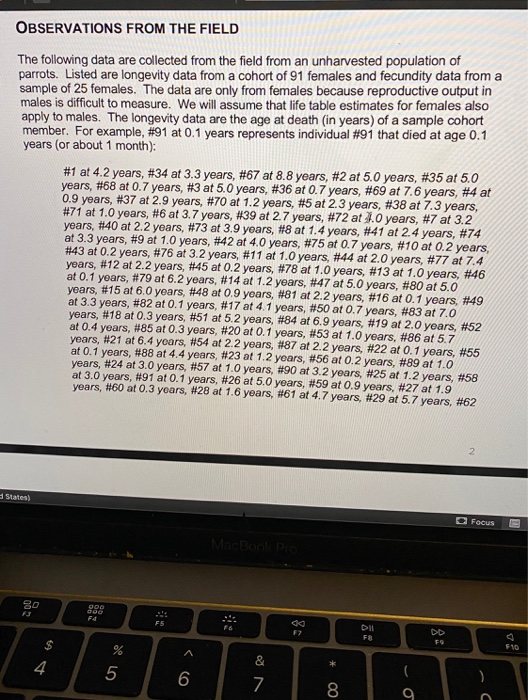
From these data you need to determine the number of individuals that survived to each age, starting with the original 91 at age 0.
Homework Answers
Data of 82 individuals are given and they are arranged according to the ages. The numbers represent the tag numbers of each bird not their ages.
For ex - 0.3 yrs -18,85,60. Here 0.4 yrs is the age of the individual and 18,85,60 are the tag numbers of the parrot .Thus a total of 3 individuals survive upto 0.3 yrs.
You can calculate the number of individuals thereby age wise.
0.1 yrs - 22, 55,91 , 46 , 16 , 82 , 20
0.2 yrs - 10, 43, 45,46
0.3 yrs - 18, 85,60
0.4 yrs- 52
0.7 yrs - 68,36,75,50
0.9 yrs- 4,48,59
1.0 - 71,9, 11,78,13, 53, 89, 57
1.2 yrs - 70,14,23,25
1.4 yrs - 8
1.6 yrs- 28
1.9 yrs- 27
2.0 yrs- 44, 19
2.2 yrs - 40, 12,81,54,87
2.3 yrs - 5
2.4 yrs- 41
2.7 yrs - 39
2.9 yrs - 37
3.0 yrs - 24, 58
3.2 yrs - 7, 76, 90
3.3 yrs - 34,74,49
3.7 yrs - 6
3.9 yrs - 73
4 yrs - 72, 42 (please check about number 72 since the age is not visible due to the cursor in your screenshot)
4.1 yrs - 17
4.2 yrs - 1
4.4 yrs - 88
4.7 yrs - 61
5.0 - 2, 35, 3, 47, 80, 26
5.2 yrs - 51
5.7 yrs - 86, 29
6.0 yrs - 15
6.2 yrs - 79
6.4 yrs - 21
6.9 yrs - 84
7.0 yrs - 83
7.3 yrs - 38
7.4 yrs - 77
7.6 yrs - 69
Add Answer to:
From these data you need
to determine the number of individuals that survived to each age,...
determine 1) the maximum stress in the bar if P=9kN. 3.0 3.2 2.8 WW 2.6 3.0...
 determine 1) the maximum stress in the bar if P=9kN.
3.0 3.2 2.8 WW 2.6 3.0 N W 2.4 N hi 2.8 2.2 svg (w - 21) K - 4.0 K 2.0 2.6 3.01 2.0 1.8 w IS 2.4 1.6 w h 1.2- 1.1 1.4 2.2 LATIN . 1.2 2.0 1.0 0 0.1 0.6 0.7 0.8 0.9 1.0 0.5 0.2 0.3 2r 0 0.4 0.5 0.1 0.2 0.3 0.4 h 3.2 mm 48 mm 32 mm Р P r =...
determine 1) the maximum stress in the bar if P=9kN.
3.0 3.2 2.8 WW 2.6 3.0 N W 2.4 N hi 2.8 2.2 svg (w - 21) K - 4.0 K 2.0 2.6 3.01 2.0 1.8 w IS 2.4 1.6 w h 1.2- 1.1 1.4 2.2 LATIN . 1.2 2.0 1.0 0 0.1 0.6 0.7 0.8 0.9 1.0 0.5 0.2 0.3 2r 0 0.4 0.5 0.1 0.2 0.3 0.4 h 3.2 mm 48 mm 32 mm Р P r =...
The following data were obtained from a 14ft (drill length) core in shale with discontinuities-bedding surface...
 The following data were obtained from a 14ft (drill length) core in shale with discontinuities-bedding surface and high angle joints. Measurements are in inches (in) 5.7 1.3 0.5 1.1 5.3 1.3 3.4 0.3 2.0 4.3 3.2 1.2 2.3 2.9 2,8 3,2 1.2 1.2 3.0 6.2 2.9 6.4 2.6 2.6 3.5 1.0 0.5 1.1 6.8 0.3 0.9 1.7 2.1 5,9 0.9 2.0 0.5 3.1 2.3 4.1 4.2 2.2 2.8 4.3 2.0 4.4 4.5 3.6 0.5 2.1 Calculate the core loss (15...
Use the following cell phone airport data speeds (Mbps) from a particular network. Find the percentile...
Use the following cell phone airport data speeds (Mbps) from a particular network. Find the percentile corresponding to the data speed 4.4 Mbps. 0.2 0.2 0.3 0.3 0.4 0.4 0.6 0.7 0.8 0.8 0.8 0.8 0.9 0.9 0.9 1.2 1.3 1.5 1.5 1.6 1.7 2.2 2.4 2.5 2.6 2.9 3.3 3.8 3.9 4.4 5.2 5.4 5.6 6.5 6.5 7.4 10.5 11.7 12.1 12.2 12.2 12.3 12.4 13.1 15.3 15.4 15.5 15.6 15.6 30.6 Percentile of 4.4= (Round to the nearest...
Consider the pressure gauge calibration data given below. What is the range of the gauge? Plot...
 Consider the pressure gauge calibration data given below. What is the range of the gauge? Plot the data using a suitable scale (include a print out of the excel, matlab, etc program used to create the graph). Identify the location of maximum hysteresis error and then express that error as a percent of full-scale. Increasing In Decreasing In Input (Standard) 0.0 Gauge Ou 2.0 3.0 4.0 5.0 0.1 1.1 2.1 3.0 Input (Standard) 5.0 4.0 3.0 2.0 1.0 0.0 Gauge...
use the following cell phone airport data speeds (mbps) from a particular network. find the percentiles...
use the following cell phone airport data speeds (mbps) from a particular network. find the percentiles corresponding to the data speed 3.7 mbps. 0.1 0.1 0.2 0.2 0.3 0.3 0.3 0.3 0.3 0.4 0.7 0.7 0.8 0.8 0.9 1.4 1.4 1.5 1.5 1.5 1.6 1.8 2.3 2.5 2.5 2.7 2.8 2.8 3.3 3.3 3.7 4.6 4.6 4.8 5.2 7.4 7.8 8.5 8.7 8.9 9.1 9.2 9.5 11.1 12.7 12.8 13.7 13.9 15.6 27.4
Use the following cell phone airport data speeds (Mbps) from a particular network. Find the percentile...
 Use the following cell phone airport data speeds (Mbps) from a particular network. Find the percentile corresponding to the data speed 1.1 Mbps. 0.1 0.2 0.3 0.4 0.5 0.6 0.1 0.7 1.5 0.1 0.7 1.5 4.8 9.7 0.8 2.2 0.2 0.9 2.3 6.4 0.9 2.4 0.8 1.8 5.5 11.2 0.3 0.9 2.6 7.9 1.7 1.1 2.9 8.4 14.6 1.5 3.1 8.6 15.5 3.8 8.7 6.7 5.3 10.5 5.6 11.2 11.6 11.6 12.2 30.6 Percentile of 1.1 = (Round to the...
Use the following cell phone airport data speeds (Mbps) from a particular network. Find the percentile...
Use the following cell phone airport data speeds (Mbps) from a particular network. Find the percentile corresponding to the data speed 8.8 Mbps. 0.1 0.2 0.3 0.3 0.4 0.4 0.4 0.5 0.5 0.6 0.6 0.6 0.6 0.7 0.7 0.9 0.9 1.1 1.2 1.3 1.3 1.3 1.8 2.4 2.7 2.7 2.8 2.9 3.3 3.9 4.2 4.4 4.7 5.4 6.7 7.2 8.2 8.5 8.6 8.7 8.8 9.4 11.1 11.6 11.8 11.9 13.1 13.8 15.6 29.1 Percentile of 8.8equals nothing (Round to the...
Use the following cell phone airport data speeds (Mbps) from a particular network. Find Upper Q...
Use the following cell phone airport data speeds (Mbps) from a particular network. Find Upper Q 3. 0.1 0.1 0.2 0.2 0.2 0.2 0.2 0.4 0.4 0.6 0.6 0.7 0.8 0.9 0.9 1.1 1.2 1.2 1.6 1.9 2.1 2.2 2.2 2.3 2.4 2.8 3.1 3.6 3.9 3.9 4.1 5.4 6.1 6.1 6.5 7.1 8.6 8.7 8.7 9.8 10.2 10.7 11.5 13.1 13.4 14.2 14.4 14.4 14.9 30.1 Upper Q 3equals nothing Mbps (Type an integer or a decimal. Do not...
To decide on the number of service counters needed for stores to be built in the...
 To decide on the number of service counters needed for stores to be built in the future, a supermarket chain wanted to obtain information on the length of time (in minutes) required to service customers. To find the distribution of customer service times, a sample of 60 customers' service times was recorded and are shown here. 0.5 1.2 5.2 1.2 0.4 3.7 0.3 0.2 3.1 1.6 0.6 2.3 1.8 0.4 2.8 1.2 1.0 1.3 1.0 0.8 1.9 1.0 0.5 1.0...
Use the following cell phone airport data speeds (Mbps) from a particular network. Find Upper Q...
Use the following cell phone airport data speeds (Mbps) from a particular network. Find Upper Q 1 0.2 0.2 0.3 0.4 0.4 0.5 0.5 0.5 0.6 0.7 0.7 0.7 0.7 0.9 0.9 0.9 0.9 1.3 1.4 1.8 1.8 1.9 2.2 2.3 2.3 2.3 2.6 3.1 3.3 3.8 4.2 4.7 5.5 6.8 7.3 8.4 9.5 11.7 12.5 12.7 13.5 13.6 13.8 13.9 14.3 14.4 14.6 14.7 15.5 25.6 Upper Q Mbps (Type an integer or a decimal. Do not round.)
 determine 1) the maximum stress in the bar if P=9kN.
3.0 3.2 2.8 WW 2.6 3.0 N W 2.4 N hi 2.8 2.2 svg (w - 21) K - 4.0 K 2.0 2.6 3.01 2.0 1.8 w IS 2.4 1.6 w h 1.2- 1.1 1.4 2.2 LATIN . 1.2 2.0 1.0 0 0.1 0.6 0.7 0.8 0.9 1.0 0.5 0.2 0.3 2r 0 0.4 0.5 0.1 0.2 0.3 0.4 h 3.2 mm 48 mm 32 mm Р P r =...
determine 1) the maximum stress in the bar if P=9kN.
3.0 3.2 2.8 WW 2.6 3.0 N W 2.4 N hi 2.8 2.2 svg (w - 21) K - 4.0 K 2.0 2.6 3.01 2.0 1.8 w IS 2.4 1.6 w h 1.2- 1.1 1.4 2.2 LATIN . 1.2 2.0 1.0 0 0.1 0.6 0.7 0.8 0.9 1.0 0.5 0.2 0.3 2r 0 0.4 0.5 0.1 0.2 0.3 0.4 h 3.2 mm 48 mm 32 mm Р P r =...
 The following data were obtained from a 14ft (drill length) core in shale with discontinuities-bedding surface and high angle joints. Measurements are in inches (in) 5.7 1.3 0.5 1.1 5.3 1.3 3.4 0.3 2.0 4.3 3.2 1.2 2.3 2.9 2,8 3,2 1.2 1.2 3.0 6.2 2.9 6.4 2.6 2.6 3.5 1.0 0.5 1.1 6.8 0.3 0.9 1.7 2.1 5,9 0.9 2.0 0.5 3.1 2.3 4.1 4.2 2.2 2.8 4.3 2.0 4.4 4.5 3.6 0.5 2.1 Calculate the core loss (15...
 Consider the pressure gauge calibration data given below. What is the range of the gauge? Plot the data using a suitable scale (include a print out of the excel, matlab, etc program used to create the graph). Identify the location of maximum hysteresis error and then express that error as a percent of full-scale. Increasing In Decreasing In Input (Standard) 0.0 Gauge Ou 2.0 3.0 4.0 5.0 0.1 1.1 2.1 3.0 Input (Standard) 5.0 4.0 3.0 2.0 1.0 0.0 Gauge...
 Use the following cell phone airport data speeds (Mbps) from a particular network. Find the percentile corresponding to the data speed 1.1 Mbps. 0.1 0.2 0.3 0.4 0.5 0.6 0.1 0.7 1.5 0.1 0.7 1.5 4.8 9.7 0.8 2.2 0.2 0.9 2.3 6.4 0.9 2.4 0.8 1.8 5.5 11.2 0.3 0.9 2.6 7.9 1.7 1.1 2.9 8.4 14.6 1.5 3.1 8.6 15.5 3.8 8.7 6.7 5.3 10.5 5.6 11.2 11.6 11.6 12.2 30.6 Percentile of 1.1 = (Round to the...
 To decide on the number of service counters needed for stores to be built in the future, a supermarket chain wanted to obtain information on the length of time (in minutes) required to service customers. To find the distribution of customer service times, a sample of 60 customers' service times was recorded and are shown here. 0.5 1.2 5.2 1.2 0.4 3.7 0.3 0.2 3.1 1.6 0.6 2.3 1.8 0.4 2.8 1.2 1.0 1.3 1.0 0.8 1.9 1.0 0.5 1.0...
Most questions answered within 3 hours.
-
In
a survey, 27 people were asked how much they spent on their child's
last birthday...
asked 1 minute ago -
Which would stimulate decreased respiration?
Hypercapnia and hypoxia
Decreased carbon dioxide and increased oxygen
Increased carbon...
asked 1 minute ago -
One question on a survey asked whether people believe in hell.
Of the possible responses, 484...
asked 26 minutes ago -
An electromagnetic wave can pass through which one of these:
a. Glass b.Iron c.
Water d....
asked 42 minutes ago -
pls review carefully and help pls
In perfect competition in long-run equilibrium, can consumer
surplus or...
asked 41 minutes ago -
What information can be presented as evidence during arbitration
proceedings?
asked 34 minutes ago -
Calculate the ratio of the resistance of 15.0 m m of aluminum
wire 2.4 mm m...
asked 44 minutes ago -
The US Census Bureau needs to estimate the median income of
females in the US, so...
asked 44 minutes ago -
in a region where a constant electric field is maintained, a
proton and an electron are...
asked 54 minutes ago -
Simple Advice to a Chief Executive
This activity requires you to advise a business’s Chief
Executive...
asked 59 minutes ago -
Calculate the mass of camphor C10H16O that contains a billion
(1.000x10^9) carbon atoms.
.
asked 1 hour ago -
In a poll of 504 human resource professionals, 46.4% said that
body piercings and tattoos were...
asked 1 hour ago