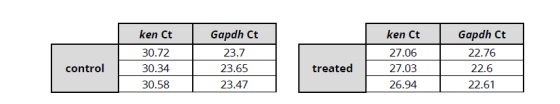
a) Using the Ct values presented in the table below, calculate
the fold change in expression for the
ken and barbie gene (ken), assuming that the ken primer pair (gene
of interest) has an efficiency of
96% and that the Gapdh primer pair (reference gene) has an
efficiency of 99%. Show your
calculations. What effect does the treatment have on the expression
of the ken gene? Explain
your answer.
b) After analyzing an RT-qPCR data set, you have determined that
there is DNA contamination in your
samples. Based on the graph on the right, identify when/how the
contaminating DNA was
introduced in your samples. Explain your answer. (4 marks)
(Note: all of the samples were amplified using a primer pair
specific to the ken gene; NRT=no reverse
transcriptase enzyme; NTC=water template control for PCR)

Homework Answers
Question a
Answer: Fold change can be calculated by using the below formula (Pfaffl method with efficiency correction)
Fold change = [(Etarget) Δct target (Mean Ct control-Mean Ct treatment)]/ [(ERef) Δct ref (Mean Ct control-Mean Ct treatment)].
Etarget = amplification factor of the target primer pair (Ken gene primer pair)
ERef = amplification factor of the reference gene primer pair (GAPDH primer pair).
ΔCt target = difference between mean ct values of control and treatment of ken gene.
ΔCt ref = difference between mean ct values of control and treatment of GAPDH gene.
During PCR, the amount of DNA double after each cycle and hence amplificatio efficiency is 100% and amplification factor is 2 (DNA amount doubles after each generation).
Given, Efficiency of the Ken gene primer pair is 96% and hence, the amplification factor will be 1.92. Efficiency of GAPDH gene primer pair is 99% and hence, amplification factor will be 1.98.
Mean of Ct of ken gene (Control) = (30.72 +30.34+30.58) / 3 = 30.54
Mean of Ct of Ken gene (Treatment) = (27.06 + 27.03+ 26.94)/3 = 27.01
Mean of Ct of GAPDH gene (Control) = (23.7 + 23.65 + 23.47)/3 = 23.60
Mean Ct of GAPDH gene (Treatment) = (22.76 + 22.6 + 22.61)/3 = 22.6
Base on the above formula, Fold change = (1.92 ( 30.54 - 27.01))/ (1.98(23.6 - 22.6)) = 5.05.
Fold change is 5.05. So, the treatment increased the expression of ken gene by five fold compare to control.
Question b
Answer: The graph show amplification in the controls (NRT and NTC). NRT has low Ct and NTC have high Ct. This indicate that the contaminant DNA is introduced during sample preparation (RNA extraction or qRT-PCR reaction setup). The contamination DNA is either from genomic DNA or from PCR reagents (Buffer, primer, dNTP). Amplification of NRT is possible if the sample RNA/cDNA is contaminated with genomic DNA. If the primers pairs used to amplify the gene (RNA/cDNA template) anneal to genomic DNA copy of the gene, amplification can be seen in NRT controls.
Add Answer to:
a) Using the Ct values presented in the table below, calculate
the fold change in expression...
Most questions answered within 3 hours.
-
Calculate the number density of argon gas at a temperature of
24C and a pressure of...
asked 1 hour ago -
Alternative
Classification
How to Estimate
Probabilities from Data? ( For continuous Attributes)
And How to generate...
asked 1 hour ago -
An explosion breaks a 20.0-kg object into three parts. The
object is initially moving at a...
asked 2 hours ago -
Calculate the approximate number of residues of Rubisco, which
is involved in carbon fixation in plants,...
asked 3 hours ago -
Other decisions about scientific claims can have a much broader
impact.ENERGYarrow-10x10.png, environment, health, security - all...
asked 4 hours ago -
I need to write a research paper and work cited about this
topic: The United States...
asked 4 hours ago -
Hello! I was wondering if I could have some help?
If the vapor pressure of carvone...
asked 5 hours ago -
An economist wants to estimate the mean per capita income (in
thousands of dollars) for a...
asked 5 hours ago -
What would be the input/output characteristic of a circuit
obtained by putting two of your 2's-complementers...
asked 5 hours ago -
In Drosophila, the transition from the syncytial blastoderm
stage to the cellular blastoderm stage is a...
asked 6 hours ago -
Project management question:
Name 3 different types of resources (hint: humans are one
type)
asked 6 hours ago -
Consider the following reaction: C 2H 2( g) + 2H 2( g) C 2H 6(
g)...
asked 6 hours ago