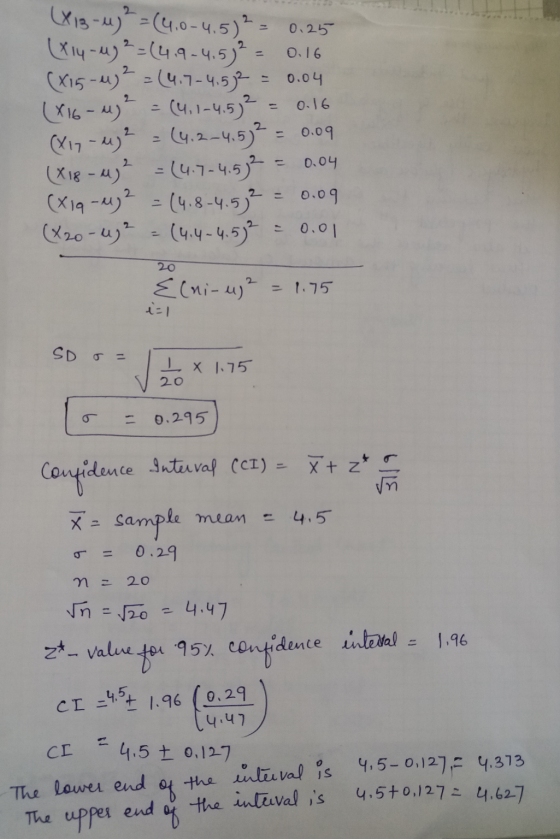
Your lab manager asks you to create the new control range for the new lot of...
Your lab manager asks you to create the new control
range for the new lot of hematology control level 1. The
following 20 hemoglobin values are gathered to determine the
control limits. Using a calculator or website SD function,
calculate and record the mean, the standard deviation, and the 95%
confidence interval for this set of values.
4.2
4.7
4.3
4.4
4.6
4.7
4.9
5.0
4.6
4.0
4.4
4.5
4.0
4.9
4.7
4.1
4.2
4.7
4.8
4.4
Mean:__________ 1 SD:__________
95% Confidence
range:________________
Given the results above, label the following
Levey-Jennings Control chart with all of the following:
Mean
Values for -3SD, -2SD, -1SD, +1SD, +2SD,
+3SD
.
You have your Levey-Jennings Control chart ready.
Your supervisor tells you to begin using the lot.
Record the first 10 days of Control 1 Hemoglobin results.
In your lab, you run controls once per day because you are a
clinic open from 8-5pm. Plot each data point on your labeled
chart and circle THOSE controls THAT ARE considered
“out.”
DAY of August
1= 4.5 mg/dl
2=4.2 mg/dl
3=4.1 mg/dl
4=4.6 mg/dl
5=4.7 mg/dl
6=4.8 mg/dl
7=4.4 mg/dl
8=4.4 mg/dl
9=4.2 mg/dl
10=4.9 mg/dl
ACCEPTABLE
OUT
OF CONTROL
You run a normal serum glucose control and obtain a
value of 78.4 mg/dL. The mean for this control is 74.8 mg/dL
and 1 SD has been calculated as 1.2. Is the value of 78.4
within 2SD (95% confidence interval)? Circle the correct
answer.
YES
NO
PART TWO
A hematology laboratory is using data reported from 2
different analyzers to determine which is more accurate for the
testing of samples in their hospital. The following data is
compiled on 30 runs of normal control. The analytes being
compared are the WBC, RBC, HGB, HCT and platelet values.
Using the EXCEL program you were introduced in the
computer lab; calculate the mean, standard deviation and
coefficient of variation for each analyte. Which analyzer is
more accurate? What led you to this conclusion? Plot
you data using the Levy-Jennings chart. Note any shifts or
trends.
Analyzer #1
WBC RBC HGB HCT Platelet
7.9 4.23 12.4 36.4 254
7.8 4.25 12.3 36.6 244
7.7 4.25 12.4 36.5 238
7.8 4.22 12.3 36.6 249
7.7 4.26 12.2 36.3 244
7.6 4.23 12.4 36.5 230
7.4 4.23 12.5 36.3 251
7.9 4.21 12.4 36.4 253
7.8 4.19 12.6 36.9 243
7.9 4.18 12.7 36.9 241
8.0 4.18 12.5 36.3 239
7.8 4.16 12.2 35.9 238
7.8 4.15 12.1 35.7 236
7.9 4.22 12.4 36.7 231
8.0 4.26 12.4 36.3 246
7.9 4.23 12.4 36.4 253
7.8 4.18 12.4 36.1 258
7.9 4.13 12.4 35.6 261
7.9 4.20 12.4 36.3 255
8.1 4.26 12.6 36.6 264
7.7 4.18 12.3 36.2 233
7.8 4.24 12.3 36.9 233
8.0 4.20 12.3 36.5 246
7.9 4.20 12.3 36.3 242
7.8 4.23 12.3 36.4 240
7.9 4.22 12.3 36.3 243
7.7 4.26 12.5 36.9 238
7.8 4.15 12.2 35.8 241
7.9 4.23 12.3 36.6 234
7.9
4.20 12.4
36.2
253
Analyzer #2
WBC RBC HGB HCT Platelet
7.8 4.23 12.5 36.4 247
7.9 4.17 12.4 36.0 250
7.8 4.23 12.3 36.5 251
7.9 4.19 12.3 36.0 259
8.1 4.23 12.4 36.1 258
8.1 4.23 12.3 36.5 256
7.8 4.21 12.4 36.4 260
7.9 4.21 12.3 36.3 263
7.9 4.21 12.5 36.2 266
8.0 4.21 12.5 36.3 265
7.8 4.23 12.1 36.6 248
7.8 4.19 12.1 36.2 233
7.8 4.19 12.4 36.4 248
7.6 4.15 12.2 35.9 241
7.7 4.21 12.3 36.6 251
7.8 4.16 12.2 36.4 233
7.8 4.20 12.3 36.5 256
7.8 4.24 12.3 36.7 244
7.8 4.19 12.4 36.1 245
8.0 4.26 12.5 37.0 251
7.9 4.21 12.4 36.6 250
7.7 4.19 12.3 36.3 254
7.8 4.22 12.3 36.6 250
7.7 4.19 12.3 36.0 252
7.8 4.16 12.2 35.9 244
7.9 4.16 12.3 35.8 260
7.9 4.20 12.3 36.3 251
7.7 4.18 12.3 36.0 251
7.8 4.23 12.4 36.5 258
7.6
4.21 12.5
36.7
256
watch Jening QC Charts and from there it would help resolve the problem I guess
Homework Answers


Add Answer to:
Your lab manager asks you to create the new control
range for the new lot of...
Most questions answered within 3 hours.
-
Explain how each of the following three conditions could be a
red flag for a register...
asked 1 minute ago -
In a two-way factorial ANOVA, the final F-ratio for
factor AxB is determined by dividing _____...
asked 31 minutes ago -
Show your solutions for answer.
4. An aqueous solution contains 9.21 g of
K4Fe(CN)6 in a...
asked 1 minute ago -
The random variable X has a uniform distribution with values
between 16 and 18. What is...
asked 11 minutes ago -
Evaluate each of the following transactions in terms of their
effect on assets, liabilities, and equity....
asked 10 minutes ago -
The amounts of nicotine in a certain brand of cigarette are
normally distributed with a mean...
asked 30 minutes ago -
The commercial lending department of First Bank made a
substantial loan to Alpha Company after obtaining...
asked 16 minutes ago -
For a reaction, reagents --->products, it's forwarding rate
(rate of products formation) is proportional to the...
asked 29 minutes ago -
5)
Typically,
there will need to be a rather high degree of coordination and
interaction among...
asked 24 minutes ago -
if the marginal revenue on each MRI is $2500, and the
marginal cost for each is...
asked 26 minutes ago -
What did Butler and Hobbes contribute to our understanding of
utilitarianism?
asked 31 minutes ago -
History
Lincoln's religious thought was almost exclusively shaped by his
Calvinist upbringing.
True
False
QUESTION 6...
asked 30 minutes ago