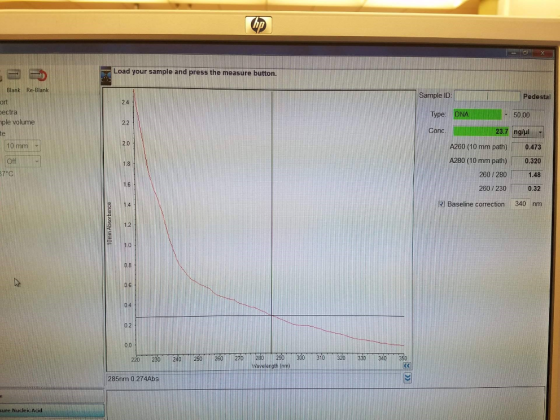
After purification of your favorite plasmid you use a spectrophotometer to find the concentration of your DNA and observe the graph below. Resketch by hand this graph on your answer page with exact axis labels and scales. Redraw the red line. Draw, in your estimation, the absorption spectrum of what is expected of a good DNA prep.
Homework Answers
Spectrophotometric analysis is a commonly used method to quantify nucleic acids (DNA and RNA). Nucleic acids show maximum absorption of light in the ultraviolet spectrum, at 260 nm. In a spectrophotometric graph, the wavelength is plotted on X-axis and the absorption is plotted on the Y-axis.
Since the nucleic acids show maximum absorption at 260 nm, the peak of the spectrophotometric graph is generally around this wavelength. In the graph given in the question, the trend of the absorption spectrum of plasmid DNA doesn't show a peak, possibly due to the presence of contaminants and substantially lower amounts of DNA. A normally expected trend of the absorption spectrum of a good DNA prep is shown in black in the below hand-drawn graph.

The image given in the question also shows the values of 260/280 and 260/230 ratios which are the ratios of the absorbance of the sample at those particular wavelengths (i.e. 230, 260 and 280 nm). These ratios are generally considered for assessing the purity of the given nucleic acid sample. Values of 1.8 and 2.0-2.2 for the 260/280 and 260/230 ratios, respectively, are generally considered as standards for 'pure' DNA samples. It is worth noting that the 260/280 and 260/230 values in the question are lower than these standards, possibly due to the presence of contaminants.
Add Answer to:
After purification of your favorite plasmid you use a
spectrophotometer to find the concentration of your...
Most questions answered within 3 hours.
-
In the following reaction, which element is undergoing
oxidation: Na2SO3 + N2O --> N2 + Na2SO4...
asked 18 minutes ago -
Which of the following pairs of ions have the same electron
configuration?
I: Br− and Se2−...
asked 2 hours ago -
The Foremost Composite Materials Company is planning a two-day
sales conference for October 19-20. The conference...
asked 3 hours ago -
3) Illustrate the observed pattern of relatedness of organisms
versus adaptations to specific conditions. This means...
asked 3 hours ago -
In winter a lake has a 0.35 m thick ice layer over 1.10 m of
water....
asked 4 hours ago -
Assuming the following has been encrypted with a Vigenere cipher
below, use the method(s) and assumptions...
asked 4 hours ago -
How would I use switch statements to write a program that will
take an input of...
asked 4 hours ago -
Imagine a reaction in which methane gas combusts at a constant
pressure of 1 atm and...
asked 4 hours ago -
Two parallel wires (each 12 m in length) are separated by a
distance of 0.065 m...
asked 4 hours ago -
Suppose there were three masses at the corner of uniform
equilateral triangle. The masses are m1...
asked 4 hours ago -
Situation: A building that is 618 m above the ground floor. How
many times would a...
asked 4 hours ago -
help me and discuss one successful and one
unsuccessful international company/busines in Indonesia.whyit
succeed and why...
asked 5 hours ago