Please explain figures 6C, 6D, 6F, and 6G in simple terms! I am having difficulty understanding the figures. I have copy and pasted a section in the article. Thank you!!
Figure 6. MLL5 Suppresses Differentiation of GBM Self-Renewing Cells
(A) Western blot to assess the effects of MLL5 knockdown in the
GBM primary culture G432NS.
(B) Western blots on cell lysates from two GBM cultures
differentiated over a 21-day period.
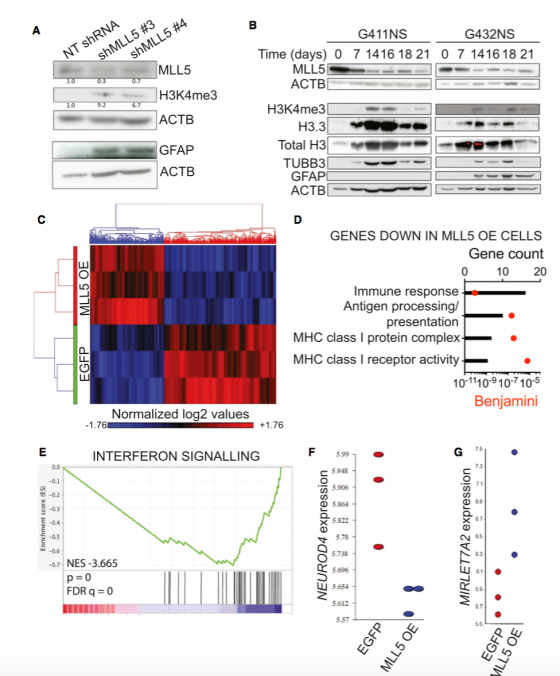
(C) Heatmap and unsupervised hierarchical clustering of differentially regulated genes (p < 0.05, < 1.2-fold or >1.2-fold) between MLL5 overexpressing cells and EGFP-expressing control cells (n = 3 biological replicates for each treatment).
(D) Gene ontology analysis of genes downregulated in MLL5 overexpressing cells.
(E) Gene set enrichment analysis of genes differentially regulated in MLL5 overexpressing cells. NES, normalized enrichment score. FDR, false discovery rate.
(F) Expression levels of NEUROD4 based on gene expression
arrays.
(G) Expression levels of MIRLET72A based on gene expression
arrays.
MLL5 Suppresses Differentiation of GBM Self-Renewing
Cells
We next investigated whether the changes in epigenetic marks and
chromatin structure mediated by MLL5 functionally resulted in
alterations of the self-renewal and tumorigenic potential of GBM
primary cultures. We observed rapid and increased expression of the
astrocytic marker glial fibrillary acidic protein (GFAP) upon
knockdown of MLL5 (Figure 6A), supporting the notion that MLL5 may
contribute to the neoplastic phenotype by suppressing
differentiation. In a complementary experiment, directed
differentiation by growth factor withdrawal in two patient-derived
GBM primary cultures, G411NS and G432NS, was associated with a
significant decrease of MLL5 levels coin- cident with upregulation
of GFAP and/or the neuronal marker bIII-tubulin (TUBB3) (Figure
6B). Importantly, as MLL5 levels decreased during induced
differentiation, H3K4me3 levels increased, consistent with our
studies above (Figures 3B and 6A). Interestingly, we observed
increased H3.3 levels with GBM differentiation, reminiscent of what
is observed with H3.3 changes during normal brain development (Pin
̃a and Suau, 1987) and neural differentiation (Hake et al., 2006),
supporting the notion that appropriate levels of H3.3 protein
incorporation into chromatin are required for cellular
differentiation.
To gain insight into the suppression of neural differentiation mediated by MLL5, we overexpressed MLL5 in G514NS and performed gene expression array analysis (Figure S5A). EGFP- expressing G514NS cells were used as controls and 252 genes were differentially expressed between MLL5 overexpressing and control cells (p < 0.05, >1.2-fold change), with more than two- thirds of them being repressed (Figure 6C). Gene ontology analysis of the genes downregulated in MLL5-overexpressing cells showed significant enrichment for genes involved in mmune response (Figures 6D and S5B). Gene set enrichment analysis specifically showed suppression of interferon signaling-related genes (Figure 6E). Interestingly, interferon signaling was previously shown to be a potent inducer of neural differentiation in neural stem and progenitor cells (Kim et al., 2007; Wong et al., 2004) and to induce differentiation and sup- press the malignant phenotype of neuroblastoma cells (Cinatl et al., 2002). Furthermore, MLL5 overexpression caused signifi- cant downregulation of NEUROD4 (Figure 6F), a master regu- lator of neurogenesis (Lee and Pfaff, 2003), and upregulation of a miRNA belonging to the LET-7 family (Figure 6G), which is known to suppress neurogenesis (Cimadamore et al., 2013).
Homework Answers
6C)
This is a heatmap that shows the genes that are upregulated or downregulated when MLL5 is Overexpressed compared to cells expressing EGFP. The data shown here is from 3 replicates, and the clustering of genes (which gene is placed next to which gene is unsupervised). MLL5 Overexpression suppresses the expression of a large fraction of genes by 2-3 fold while increasing the expression of some genes 2-3 fold.
6D)
This figure shows gene pathways/gene groups that are downregulated in MLL5 overexpression. The red dots labeled Benjamini is a p-value correction, that adjusts data to account for the False Discovery Rate (False +ve error correction). The various gene classes shown on the y-axis are downregulated when MLL5 is overexpressed.
6F-6G)
Both these figures show a comparative analysis of the expression level of one gene in the Wild-type and MLL5 overexpression genotype. The data shown is in triplicates, such that gene expression levels for NEUROD4 (6F) and MIRLET7A2 (6G) were assayed three times in wild type cells and three times in MLL5 overexpression cells.
NEUROD4 expression is suppressed in MLL5 overexpression. NEUROD4 is a regulator of Neurogenesis and the downregulation of NEUROD4 indicates that MLL5 overexpression is inhibiting the differentiation of cells into Neuronal cells.
On the other hand, MIRLET7A2 is an miRNA species that represses neurognesis. This miRNA is a repressor of Neurogenesis and the overepression of this RNA species again allows MLL5 Overexpression cells to escape differentiation.
Add Answer to:
Please explain figures 6C, 6D, 6F, and 6G in simple
terms! I am having difficulty understanding...
Please explain figures 6C, 6D, 6F, 6E, and 6G in simple terms! I am having difficulty...
 Please explain figures 6C, 6D, 6F, 6E, and 6G in simple terms! I
am having difficulty understanding the figures. I have copy and
pasted a section in the article. Thank you!!
Figure 6. MLL5 Suppresses Differentiation of GBM
Self-Renewing Cells
(A) Western blot to assess the effects of MLL5 knockdown in the
GBM primary culture G432NS.
(B) Western blots on cell lysates from two GBM cultures
differentiated over a 21-day period.
(C) Heatmap and unsupervised hierarchical clustering of
differentially regulated...
Please explain figures 6C, 6D, 6F, 6E, and 6G in simple terms! I
am having difficulty understanding the figures. I have copy and
pasted a section in the article. Thank you!!
Figure 6. MLL5 Suppresses Differentiation of GBM
Self-Renewing Cells
(A) Western blot to assess the effects of MLL5 knockdown in the
GBM primary culture G432NS.
(B) Western blots on cell lysates from two GBM cultures
differentiated over a 21-day period.
(C) Heatmap and unsupervised hierarchical clustering of
differentially regulated...
Explain the following in terms a highschooler would understand (from article Expression of HoxD Genes in...
Explain the following in terms a highschooler would understand (from article Expression of HoxD Genes in Developing and Regenerating Axolotl Limbs, 1998): DISCUSSION: Expression of HoxD genes in developing axolotl limb buds. We have examined the expression of Hoxd-8, Hoxd10, and Hoxd-11 genes in axolotl limb buds and find many similarities between the patterns of expression in axolotls and those described for other vertebrates. Similarities are most pronounced in phases I and II (Nelson et al., 1996; Shubin et al.,...
does anyone know what High and low group means in this context? i really do not...
 does anyone know what High and low group means in this
context? i really do not understand this article so anyone that
does please explain it to me and what the hugh and low group mean
in the figures.
Received: 21 November 2018 Revised: 27 February 2019 Accepted: 6 March 2019 DOE: 10.1002p28546 ORIGINAL RESEARCnes-highdearee of intra modole connecHvity WILEYa Phypliology ARTICLE Four novel biomarkers for bladder cancer identified by weighted gene coexpression network analysis Zi-Xin Guo | Xiao-Ping Liu...
does anyone know what High and low group means in this
context? i really do not understand this article so anyone that
does please explain it to me and what the hugh and low group mean
in the figures.
Received: 21 November 2018 Revised: 27 February 2019 Accepted: 6 March 2019 DOE: 10.1002p28546 ORIGINAL RESEARCnes-highdearee of intra modole connecHvity WILEYa Phypliology ARTICLE Four novel biomarkers for bladder cancer identified by weighted gene coexpression network analysis Zi-Xin Guo | Xiao-Ping Liu...
 Please explain figures 6C, 6D, 6F, 6E, and 6G in simple terms! I
am having difficulty understanding the figures. I have copy and
pasted a section in the article. Thank you!!
Figure 6. MLL5 Suppresses Differentiation of GBM
Self-Renewing Cells
(A) Western blot to assess the effects of MLL5 knockdown in the
GBM primary culture G432NS.
(B) Western blots on cell lysates from two GBM cultures
differentiated over a 21-day period.
(C) Heatmap and unsupervised hierarchical clustering of
differentially regulated...
Please explain figures 6C, 6D, 6F, 6E, and 6G in simple terms! I
am having difficulty understanding the figures. I have copy and
pasted a section in the article. Thank you!!
Figure 6. MLL5 Suppresses Differentiation of GBM
Self-Renewing Cells
(A) Western blot to assess the effects of MLL5 knockdown in the
GBM primary culture G432NS.
(B) Western blots on cell lysates from two GBM cultures
differentiated over a 21-day period.
(C) Heatmap and unsupervised hierarchical clustering of
differentially regulated...
 does anyone know what High and low group means in this
context? i really do not understand this article so anyone that
does please explain it to me and what the hugh and low group mean
in the figures.
Received: 21 November 2018 Revised: 27 February 2019 Accepted: 6 March 2019 DOE: 10.1002p28546 ORIGINAL RESEARCnes-highdearee of intra modole connecHvity WILEYa Phypliology ARTICLE Four novel biomarkers for bladder cancer identified by weighted gene coexpression network analysis Zi-Xin Guo | Xiao-Ping Liu...
does anyone know what High and low group means in this
context? i really do not understand this article so anyone that
does please explain it to me and what the hugh and low group mean
in the figures.
Received: 21 November 2018 Revised: 27 February 2019 Accepted: 6 March 2019 DOE: 10.1002p28546 ORIGINAL RESEARCnes-highdearee of intra modole connecHvity WILEYa Phypliology ARTICLE Four novel biomarkers for bladder cancer identified by weighted gene coexpression network analysis Zi-Xin Guo | Xiao-Ping Liu...
Most questions answered within 3 hours.
-
What mechanisms Drive speciation??
(I.e. what was Dawins theory on the orgin of species, and how...
asked 1 hour ago -
The manager at a car assembly plant believes that the mean
assembly time for a car...
asked 1 hour ago -
Which of the following is true of electron capture?
A) It decreases the nuclide's mass number...
asked 3 hours ago -
Assuming an efficiency of 43.10%, calculate the actual yield of
magnesium nitrate formed from 114.9 g...
asked 4 hours ago -
The highly pathogenic bacterium Clostridium
perfringens causes gangrene, a disease that results in the
destruction of...
asked 5 hours ago -
In the context of situation analysis, which of the following is
a category for analysis in...
asked 5 hours ago -
In a study of the gas phase decomposition of sulfuryl chloride
at 600 K SO2Cl2(g)SO2(g) +...
asked 5 hours ago -
75 g of 2-propanol (C3H8O) and 25 g of pentane are mixed in a
200 mL...
asked 5 hours ago -
The 2800-turn coil in a dc motor has an area per turn of 1.1 ×
10-2...
asked 6 hours ago -
Draw a combinational logic circuit diagram with a symbol inside
the box for two I/P of...
asked 6 hours ago -
The cliché we use quite a lot in finance is: there is a need to
maximize...
asked 6 hours ago -
In class we discussed the addition of HCl to alpha pinene. Would
you expect one or...
asked 6 hours ago