
Homework Answers
Add Answer to:
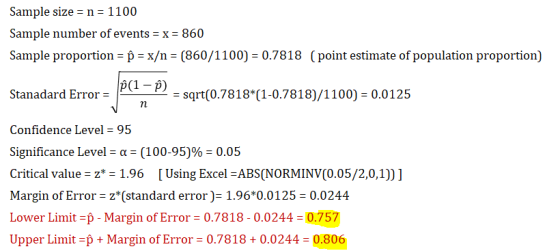
Construct a confidence interval of the population proportion at the given level of confidence. x =...
Construct a confidence interval of the population proportion at the given level of confidence x=860, n=1100,...
 Construct a confidence interval of the population proportion at the given level of confidence x=860, n=1100, 94% confidence The lower bound of the confidence interval is (Round to three decimal places as needed.) The upper bound of the confidence interval is (Round to three decimal places as needed.)
and i need help finding the upper bound confidence interval as well Construct a confidence interval...
 and i need help finding the upper bound confidence interval as
well
Construct a confidence interval of the population proportion at the given level of confidence. x = 120, n = 1200, 95% confidence Click here to view the standard normal distribution table (page 1). Click here to view the standard normal distribution table (page 2). The lower bound of the confidence interval is LI. (Round to three decimal places as needed.)
and i need help finding the upper bound confidence interval as
well
Construct a confidence interval of the population proportion at the given level of confidence. x = 120, n = 1200, 95% confidence Click here to view the standard normal distribution table (page 1). Click here to view the standard normal distribution table (page 2). The lower bound of the confidence interval is LI. (Round to three decimal places as needed.)
Construct a confidence interval of the population proportion at the given level of confidence. x- 120,...
 Construct a confidence interval of the population proportion at the given level of confidence. x- 120, n 1200, 99% confidence The lower bound of the confidence interval is (Round to three decimal places as needed.) The upper bound of the confidence interval is (Round to three decimal places as needed.) Construct a 99% confidence interval of the population proportion using the given information. X 105, n 150 The lower bound is The upper bound is (Round to three decimal places...
Construct a 95% confidence interval of the population proportion using the given information. x= 125, n...
 Construct a 95% confidence interval of the population proportion using the given information. x= 125, n = 250 Click here to view the table of critical values. The lower bound is 454 The upper bound is 546 (Round to three decimal places as needed.)
Construct a confidence interval of the population proportion at the given level of confidence. x =540,...
Construct a confidence interval of the population proportion at the given level of confidence. x =540, n=1100, 95% confidence The lower bound of the confidence interval is ____. (Round to 3 decimal places as needed.)
Construct a 96% confidence interval to estimate the population proportion with a sample proportion equal to...
 Construct a 96% confidence interval to estimate the population proportion with a sample proportion equal to 0.36 and a sample size equal to 100. Click the icon to view a portion of the Cumulative Probabilities for the Standard Normal Distribution table A 95% confidence interval estimates that the population proportion is between a lower limit of (Round to three decimal places as needed) and an upper limit of
Construct a 99% confidence interval of the population proportion using the given information. x = 40,...
 Construct a 99% confidence interval of the population proportion using the given information. x = 40, n=200 Click here to view the table of critical values. The lower bound is The upper bound is (Round to three decimal places as needed.)
Construct a 99% confidence interval of the population proportion using the given information. x = 75,...
 Construct a 99% confidence interval of the population proportion using the given information. x = 75, n = 150 Click here to view the table of critical values. The lower bound is The upper bound is (Round to three decimal places as needed.)
Construct a 95% confidence interval of the population proportion using the given information. x= 125, n...
 Construct a 95% confidence interval of the population proportion using the given information. x= 125, n = 250 Click here to view the table of critical values. The lower bound is The upper bound is (Round to three decimal places as needed.) i Table of critical values x Level of Confidence, (1 - «) - 100% CK Area in Each Tail, 2 Critical Value, 2 90% 0.05 1.645 95% 0.025 1.96 2.575 99% 0.005 Print Done
X 9.1.15 Construct a 99% confidence interval of the population proportion using the given information. X...
 X 9.1.15 Construct a 99% confidence interval of the population proportion using the given information. X = 125, n = 250 Click here to view the table of critical values. The lower bound is a The upper bound is (Round to three decimal places as needed.) - X Table of critical values Area in Each Toil, Critical Value 4,4 L645 Level of Confidence, (1 - a). 100% 90% 95% 99% 0.05 0.025 0.005 1.96 2.575 Print Done ou al
 Construct a confidence interval of the population proportion at the given level of confidence x=860, n=1100, 94% confidence The lower bound of the confidence interval is (Round to three decimal places as needed.) The upper bound of the confidence interval is (Round to three decimal places as needed.)
 and i need help finding the upper bound confidence interval as
well
Construct a confidence interval of the population proportion at the given level of confidence. x = 120, n = 1200, 95% confidence Click here to view the standard normal distribution table (page 1). Click here to view the standard normal distribution table (page 2). The lower bound of the confidence interval is LI. (Round to three decimal places as needed.)
and i need help finding the upper bound confidence interval as
well
Construct a confidence interval of the population proportion at the given level of confidence. x = 120, n = 1200, 95% confidence Click here to view the standard normal distribution table (page 1). Click here to view the standard normal distribution table (page 2). The lower bound of the confidence interval is LI. (Round to three decimal places as needed.)
 Construct a confidence interval of the population proportion at the given level of confidence. x- 120, n 1200, 99% confidence The lower bound of the confidence interval is (Round to three decimal places as needed.) The upper bound of the confidence interval is (Round to three decimal places as needed.) Construct a 99% confidence interval of the population proportion using the given information. X 105, n 150 The lower bound is The upper bound is (Round to three decimal places...
 Construct a 95% confidence interval of the population proportion using the given information. x= 125, n = 250 Click here to view the table of critical values. The lower bound is 454 The upper bound is 546 (Round to three decimal places as needed.)
 Construct a 96% confidence interval to estimate the population proportion with a sample proportion equal to 0.36 and a sample size equal to 100. Click the icon to view a portion of the Cumulative Probabilities for the Standard Normal Distribution table A 95% confidence interval estimates that the population proportion is between a lower limit of (Round to three decimal places as needed) and an upper limit of
 Construct a 99% confidence interval of the population proportion using the given information. x = 40, n=200 Click here to view the table of critical values. The lower bound is The upper bound is (Round to three decimal places as needed.)
 Construct a 99% confidence interval of the population proportion using the given information. x = 75, n = 150 Click here to view the table of critical values. The lower bound is The upper bound is (Round to three decimal places as needed.)
 Construct a 95% confidence interval of the population proportion using the given information. x= 125, n = 250 Click here to view the table of critical values. The lower bound is The upper bound is (Round to three decimal places as needed.) i Table of critical values x Level of Confidence, (1 - «) - 100% CK Area in Each Tail, 2 Critical Value, 2 90% 0.05 1.645 95% 0.025 1.96 2.575 99% 0.005 Print Done
 X 9.1.15 Construct a 99% confidence interval of the population proportion using the given information. X = 125, n = 250 Click here to view the table of critical values. The lower bound is a The upper bound is (Round to three decimal places as needed.) - X Table of critical values Area in Each Toil, Critical Value 4,4 L645 Level of Confidence, (1 - a). 100% 90% 95% 99% 0.05 0.025 0.005 1.96 2.575 Print Done ou al
Most questions answered within 3 hours.
-
After one round of replication in 14-N media for the Meselson
Stahl experiment, scientists could conclude...
asked 21 seconds from now -
how
does the process of separation of powers function in the united
states, what are its...
asked 3 minutes ago -
If you calculated the concentration of β-carotene in your 2.50
mL sample to be 2.389 ×...
asked 7 minutes ago -
Shanghai Company sells glasses, fine china, and everyday
dinnerware. It uses activity-based costing to determine the...
asked 3 minutes ago -
During the current year D sold a property in class 12 for
$9,000. The property had...
asked 17 minutes ago -
a)i What constant acceleration, in SI units, must a car have to
go from zero to...
asked 17 minutes ago -
Consider a long, closely wound solenoid with 10,000 turns per
meter.
What current, in amperes, is...
asked 21 minutes ago -
14. What organism causes syphilis? How can it be treated and
prevented? Describe the stages of...
asked 21 minutes ago -
Please code this in C++:
// Start
// Declarations
// number currentTuition
// number futureTuition
//...
asked 23 minutes ago -
How does ethics
contribute to customer satisfaction? Assume for your the answer,
the business is either...
asked 37 minutes ago -
Corporate Social Responsibility (CSR) is an initiative to assess
and take responsibility for a company’s impact...
asked 39 minutes ago -
(2 pts) Find the percent of observations from a standard normal
distribution that satisfies each of...
asked 1 hour ago