
Homework Answers


Add Answer to:
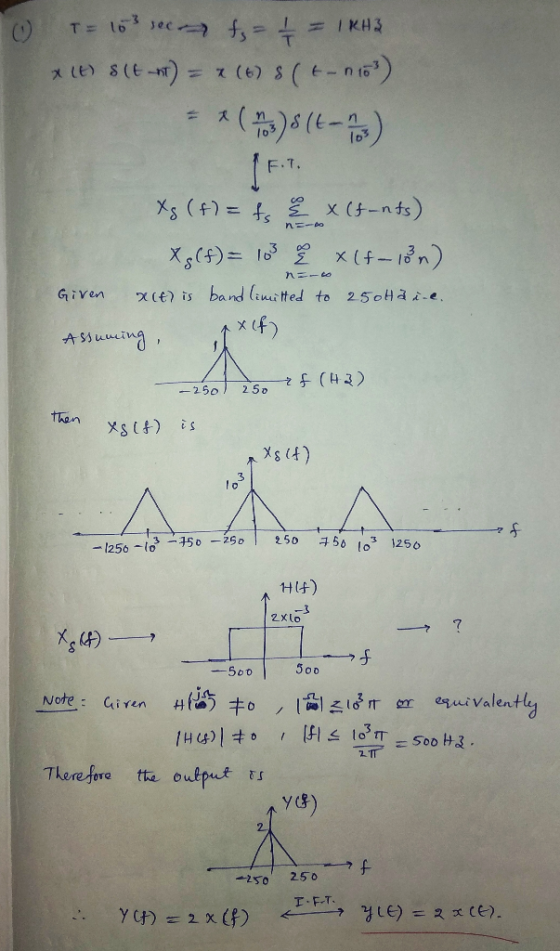
지↓) Assuming 자t) is band l:mited to asoHz uhat is g(L) as a Rndial Consider the...
Suppose that r(l) is a band-limited signal with the bandwidth W. Suppose that we sampled this...
 Suppose that r(l) is a band-limited signal with the bandwidth W. Suppose that we sampled this signal with the sainpling interval T, to generate the sample sequence 1 TLI suppose that 2n/T is larger than the Nyquist rate 2W Given rn, we reconstructed a conius time signal ( using the zero-order-hold method. In other words, rr(l) n for L E [nT, (n +1)T;). In the last lecture, we derived that where s(), as usual, denotes the continuous time representation of...
a) Derive the frequency domain representation X() of a band-limited signal r(t) that has been uniformly sampled in time to become r(n). b) Derive the expression of the reconstructed signal r(t) from...
 a) Derive the frequency domain representation X() of a band-limited signal r(t) that has been uniformly sampled in time to become r(n). b) Derive the expression of the reconstructed signal r(t) from the discrete time signal (n). Show all steps in detail: the sampling/reconstruction functions and processes both in the time and the frequency domain
a) Derive the frequency domain representation X() of a band-limited signal r(t) that has been uniformly sampled in time to become r(n). b) Derive the...
a) Derive the frequency domain representation X() of a band-limited signal r(t) that has been uniformly sampled in time to become r(n). b) Derive the expression of the reconstructed signal r(t) from the discrete time signal (n). Show all steps in detail: the sampling/reconstruction functions and processes both in the time and the frequency domain
a) Derive the frequency domain representation X() of a band-limited signal r(t) that has been uniformly sampled in time to become r(n). b) Derive the...
1. Consider a signal of the form (t) = 2 cos(100nt) cos(1507) This signal is first...
 1. Consider a signal of the form (t) = 2 cos(100nt) cos(1507) This signal is first sampled at the rate of 80 samples per second and the result was processed with an ideal reconstruction filter, again assuming that sampling rate was 80 samples per second. What is the signal that results after the reconstruction? Show enough details in your answer to demonstrate that you understand the theory of sampling and reconstruction from samples. Hint: Write (t) as a sum of...
Question 5 (a) The impulse response of a discrete-time filter is given as, hin) 0.56n-1] +n-2)0.5...
 Question 5 (a) The impulse response of a discrete-time filter is given as, hin) 0.56n-1] +n-2)0.56 n -3]. i. Derive the filter's frequency response; 11. Roughly sketch the filter's magnitude response for 0 ii. Is it a low-pass or high-pass filter? Ω 2m; (b) A continuous-time signal se(t) is converted into a discrete-time signal as shown below. s(t) is a unit impulse train. s(t) x,) Conversion into x(1) __→ⓧ一ㄅㄧ-discrete-time sequence ー→ xu [n] The frequency spectrum of ap (t) is...
Two signals m1(t) and m2(t), both band-limited to 5000 Hz, are to be transmitted simultaneously over...
 Two signals m1(t) and m2(t), both band-limited to 5000 Hz, are
to be transmitted simultaneously over a channel by the multiplexing
scheme shown in the following figure.The signal at point b is the
multiplexed signal, which now modulates a carrier of frequency
20,000 Hz. The modulated signal at point c is transmitted over a
channel.
4. [20 points] Two signals m(t) and m-(t), both band-limited to 5000 Hz, are to be transmitted simultaneously over a channel by the multiplexing scheme...
Two signals m1(t) and m2(t), both band-limited to 5000 Hz, are
to be transmitted simultaneously over a channel by the multiplexing
scheme shown in the following figure.The signal at point b is the
multiplexed signal, which now modulates a carrier of frequency
20,000 Hz. The modulated signal at point c is transmitted over a
channel.
4. [20 points] Two signals m(t) and m-(t), both band-limited to 5000 Hz, are to be transmitted simultaneously over a channel by the multiplexing scheme...
Figure 2.4 shows a block diagram that consists of Device A with a transfer function of Vo1(t) = 1 + vi(t)2 and a Band P...
 Figure 2.4 shows a block diagram that consists of Device A with a transfer function of Vo1(t) = 1 + vi(t)2 and a Band Pass Filter that has a cutoff frequency of 6 kHz and 12 kHz. The input signal to the device is a 8 V sinusoidal signal Amplitude 8V Vot(t) Band Pass Device A Vo2(t) Time Vo1(t) 1vi(t) Filter 0.2ms Input signal, vi(t) Fiqure 2.4 State the expression of the input signal, vi(t) given that the signal is...
3: (Practice Problem)Consider the representation of the process of sampling followed by reconstruction shown below oce=nt)...
 3: (Practice Problem)Consider the representation of the process of sampling followed by reconstruction shown below oce=nt) C) Assume that the input signal is Ia(t) = 2 cos(100nt – /4) + cos(300nt + 7/3) -0<t< The frequency response of the reconstruction filter is H.(12) = {T 121</T 10 1921 > A/T (a) Determine the continuous-time Fourier transform X (12) and plot it as a function of N. (b) Assume the fs = 1/T = 500 samples/sec and plot the Fourier transform...
5. Consider the following message signal: m(t) -2 .3 10 Assume that the carrier frequency is f ar...
 5. Consider the following message signal: m(t) -2 .3 10 Assume that the carrier frequency is f are kf = 105, kp-25 respectively. 108 Hz, and frequency and phase deviation constants Find the maximum and minimum frequency deviation for FM, and sketch the FM wave for a duration of 103 seconds shown in the above figure (5 points). a. b. Find the maximum and minimum frequency deviation for PM, sketch the PM wave for a duration of 103 seconds shown...
please can discuss how you solve it For a continuous-time band-limited signal, x(t) = cos (4000nt)...
 please can discuss how you solve it
For a continuous-time band-limited signal, x(t) = cos (4000nt) compute Nyquist sampling rate, 125. Also compute first 10 samples of the sampled signal, x (nts), for n > 0, that is, n 0 1 2 3 4 5 6 7 8 9 x(nts) Re-compute first 10 samples of the sampled signal, x(nts), for n > 0, that is, 0 2 3 4 8 9 x(nts) n 1 5 6 7 if x(t) is...
please can discuss how you solve it
For a continuous-time band-limited signal, x(t) = cos (4000nt) compute Nyquist sampling rate, 125. Also compute first 10 samples of the sampled signal, x (nts), for n > 0, that is, n 0 1 2 3 4 5 6 7 8 9 x(nts) Re-compute first 10 samples of the sampled signal, x(nts), for n > 0, that is, 0 2 3 4 8 9 x(nts) n 1 5 6 7 if x(t) is...
3 Sampling and aliasing The aim of this part is to demonstrate the effects of aliasing...
 3 Sampling and aliasing The aim of this part is to demonstrate the effects of aliasing arising from improper sampling. A given analog signal z(t) is sampled at a rate fs = 1/T, the resulting samples (nT) are then reconstructed by an ideal reconstructor into the analog signal rat). Improper choice of f, will result in different signals ra(t) + (t), even though they agree at their sample values, that is, tanT) = x(nT). The procedure is illustrated by the...
 Suppose that r(l) is a band-limited signal with the bandwidth W. Suppose that we sampled this signal with the sainpling interval T, to generate the sample sequence 1 TLI suppose that 2n/T is larger than the Nyquist rate 2W Given rn, we reconstructed a conius time signal ( using the zero-order-hold method. In other words, rr(l) n for L E [nT, (n +1)T;). In the last lecture, we derived that where s(), as usual, denotes the continuous time representation of...
 a) Derive the frequency domain representation X() of a band-limited signal r(t) that has been uniformly sampled in time to become r(n). b) Derive the expression of the reconstructed signal r(t) from the discrete time signal (n). Show all steps in detail: the sampling/reconstruction functions and processes both in the time and the frequency domain
a) Derive the frequency domain representation X() of a band-limited signal r(t) that has been uniformly sampled in time to become r(n). b) Derive the...
a) Derive the frequency domain representation X() of a band-limited signal r(t) that has been uniformly sampled in time to become r(n). b) Derive the expression of the reconstructed signal r(t) from the discrete time signal (n). Show all steps in detail: the sampling/reconstruction functions and processes both in the time and the frequency domain
a) Derive the frequency domain representation X() of a band-limited signal r(t) that has been uniformly sampled in time to become r(n). b) Derive the...
 1. Consider a signal of the form (t) = 2 cos(100nt) cos(1507) This signal is first sampled at the rate of 80 samples per second and the result was processed with an ideal reconstruction filter, again assuming that sampling rate was 80 samples per second. What is the signal that results after the reconstruction? Show enough details in your answer to demonstrate that you understand the theory of sampling and reconstruction from samples. Hint: Write (t) as a sum of...
 Question 5 (a) The impulse response of a discrete-time filter is given as, hin) 0.56n-1] +n-2)0.56 n -3]. i. Derive the filter's frequency response; 11. Roughly sketch the filter's magnitude response for 0 ii. Is it a low-pass or high-pass filter? Ω 2m; (b) A continuous-time signal se(t) is converted into a discrete-time signal as shown below. s(t) is a unit impulse train. s(t) x,) Conversion into x(1) __→ⓧ一ㄅㄧ-discrete-time sequence ー→ xu [n] The frequency spectrum of ap (t) is...
 Two signals m1(t) and m2(t), both band-limited to 5000 Hz, are
to be transmitted simultaneously over a channel by the multiplexing
scheme shown in the following figure.The signal at point b is the
multiplexed signal, which now modulates a carrier of frequency
20,000 Hz. The modulated signal at point c is transmitted over a
channel.
4. [20 points] Two signals m(t) and m-(t), both band-limited to 5000 Hz, are to be transmitted simultaneously over a channel by the multiplexing scheme...
Two signals m1(t) and m2(t), both band-limited to 5000 Hz, are
to be transmitted simultaneously over a channel by the multiplexing
scheme shown in the following figure.The signal at point b is the
multiplexed signal, which now modulates a carrier of frequency
20,000 Hz. The modulated signal at point c is transmitted over a
channel.
4. [20 points] Two signals m(t) and m-(t), both band-limited to 5000 Hz, are to be transmitted simultaneously over a channel by the multiplexing scheme...
 Figure 2.4 shows a block diagram that consists of Device A with a transfer function of Vo1(t) = 1 + vi(t)2 and a Band Pass Filter that has a cutoff frequency of 6 kHz and 12 kHz. The input signal to the device is a 8 V sinusoidal signal Amplitude 8V Vot(t) Band Pass Device A Vo2(t) Time Vo1(t) 1vi(t) Filter 0.2ms Input signal, vi(t) Fiqure 2.4 State the expression of the input signal, vi(t) given that the signal is...
 3: (Practice Problem)Consider the representation of the process of sampling followed by reconstruction shown below oce=nt) C) Assume that the input signal is Ia(t) = 2 cos(100nt – /4) + cos(300nt + 7/3) -0<t< The frequency response of the reconstruction filter is H.(12) = {T 121</T 10 1921 > A/T (a) Determine the continuous-time Fourier transform X (12) and plot it as a function of N. (b) Assume the fs = 1/T = 500 samples/sec and plot the Fourier transform...
 5. Consider the following message signal: m(t) -2 .3 10 Assume that the carrier frequency is f are kf = 105, kp-25 respectively. 108 Hz, and frequency and phase deviation constants Find the maximum and minimum frequency deviation for FM, and sketch the FM wave for a duration of 103 seconds shown in the above figure (5 points). a. b. Find the maximum and minimum frequency deviation for PM, sketch the PM wave for a duration of 103 seconds shown...
 please can discuss how you solve it
For a continuous-time band-limited signal, x(t) = cos (4000nt) compute Nyquist sampling rate, 125. Also compute first 10 samples of the sampled signal, x (nts), for n > 0, that is, n 0 1 2 3 4 5 6 7 8 9 x(nts) Re-compute first 10 samples of the sampled signal, x(nts), for n > 0, that is, 0 2 3 4 8 9 x(nts) n 1 5 6 7 if x(t) is...
please can discuss how you solve it
For a continuous-time band-limited signal, x(t) = cos (4000nt) compute Nyquist sampling rate, 125. Also compute first 10 samples of the sampled signal, x (nts), for n > 0, that is, n 0 1 2 3 4 5 6 7 8 9 x(nts) Re-compute first 10 samples of the sampled signal, x(nts), for n > 0, that is, 0 2 3 4 8 9 x(nts) n 1 5 6 7 if x(t) is...
 3 Sampling and aliasing The aim of this part is to demonstrate the effects of aliasing arising from improper sampling. A given analog signal z(t) is sampled at a rate fs = 1/T, the resulting samples (nT) are then reconstructed by an ideal reconstructor into the analog signal rat). Improper choice of f, will result in different signals ra(t) + (t), even though they agree at their sample values, that is, tanT) = x(nT). The procedure is illustrated by the...
Most questions answered within 3 hours.
-
A coach uses a new technique to train gymnasts. Seven
gymnasts were randomly selected and their...
asked 9 minutes ago -
While rotating the tires on your car you notice a rock [mass =
0.1 Kg] stuck...
asked 2 hours ago -
Using MARS simulator, write MIPS programs according to
the following scenarios: Receive a positive integer number...
asked 3 hours ago -
An object in front of a concave mirror has a real image that is
11.5 cm...
asked 4 hours ago -
Consider the reaction, C3 H8 + O2 --> CO2 + H2O. How many
moles of O2...
asked 5 hours ago -
You and your opponent both roll a fair die. If you both roll the
same number,...
asked 6 hours ago -
In a study of the accuracy of fast food drive-through orders,
Restaurant A had 257 accurate...
asked 6 hours ago -
Identify and describe in detail the four categories of
institutions that could be included in a...
asked 6 hours ago -
In python
class Customer:
def __init__(self, customer_id, last_name, first_name, phone_number, address):
self._customer_id = int(customer_id)
self._last_name =...
asked 6 hours ago -
What is an example of a limitation in implementing a new
ERP system and how it...
asked 6 hours ago -
In a section of 9.7cm of an artery with a radius of 2.6mm there
is a...
asked 6 hours ago -
the two carboxylic acid groups of aspartic acid have different
acidities with pKa values of 2.1...
asked 6 hours ago