
Homework Answers

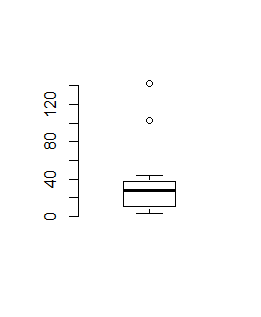
box plot of x
box plot of y

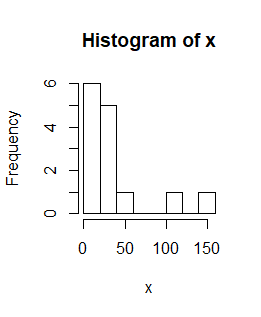
y variable is seen to have a normal distribution however x is assumed to have normal distn

for variable y


x and y are said to have sampled from normal distribution
scatterplot between x and y is

x and y are likely to have linear relationship
m=lm(y~x)
> summary(m)
Call:
lm(formula = y ~ x)
Residuals:
Min 1Q Median 3Q
-15.761 -1.694 0.762 1.352
Max
7.188
Coefficients:
Estimate Std. Error
(Intercept) 0.62614 2.13541
x 0.65229 0.04041
t value Pr(>|t|)
(Intercept) 0.293 0.774
x 16.142 1.67e-09
(Intercept)
x ***
---
Signif. codes:
0 ‘***’ 0.001 ‘**’ 0.01 ‘*’
0.05 ‘.’ 0.1 ‘ ’ 1
Residual standard error: 5.715 on 12 degrees of freedom
Multiple R-squared: 0.956, Adjusted R-squared:
0.9523
F-statistic: 260.6 on 1 and 12 DF, p-value: 1.675e-09
the line is
y=0.626+0.652*x
required proportion is nothing but r squared that is coefficient of determination =0.956
when x=20
predict(m,20)
predicted value=13.66
when x is 200 it is not a good idea to use least squares method since the value lies outside the interval of x thus it would give a wrong prediction
Add Answer to:
3. (Ch 2, Ch 3) A study to assess the capability of subsurface flow wetland systems...
2. You are a consultant hired by the city government of a community considering the development...
 2. You are a consultant hired by the city government of a community considering the development of a light rail mass transit system. The data you have to help you make recommendations to the city are given in the table of data on similar mass transit systems in 11 different U.S. cities shown below (USA Today - 12/28/04): Stations 38 14 53 City Atlanta Baltimore Boston Chicago Cleveland Los Angeles Miami New York Philadelphia San Francisco Washington 144 18 16...
PLEASE ANSWER ALL parts . IF YOU CANT ANSWER ALL, KINDLY ANSWER PART (E) AND PART(F)...
 PLEASE ANSWER ALL parts .
IF YOU CANT ANSWER ALL, KINDLY ANSWER PART (E) AND
PART(F)
FOR PART (E) THE REGRESSION MODEL IS ALSO GIVE AT THE
END.
REGRESSION MODEL:
We will be returning to the mtcars dataset, last seen in assignment 4. The dataset mtcars is built into R. It was extracted from the 1974 Motor Trend US magazine, and comcaprises fuel consumption and 10 aspects of automobile design and performance for 32 automobiles (1973-74 models). You can find...
PLEASE ANSWER ALL parts .
IF YOU CANT ANSWER ALL, KINDLY ANSWER PART (E) AND
PART(F)
FOR PART (E) THE REGRESSION MODEL IS ALSO GIVE AT THE
END.
REGRESSION MODEL:
We will be returning to the mtcars dataset, last seen in assignment 4. The dataset mtcars is built into R. It was extracted from the 1974 Motor Trend US magazine, and comcaprises fuel consumption and 10 aspects of automobile design and performance for 32 automobiles (1973-74 models). You can find...
Situation (note: Problem 2 is not linked with Problem 1): Assuming the design flow rate of...
 Situation (note: Problem 2 is not linked with Problem 1): Assuming the design flow rate of raw wastewater to be treated is 20 MGD in the design year, the dissolved BODs is 380 mg/L, and SS is 360 mg/L. The wastewater generated by the sludge treatment process is about 4 MGD with the dissolved BODs being 1800 mg/L, and SS being 1200 mg/L, and will be returned to the wet well in the pumping station at the beginning of the...
For this exercise we will run a regression using Swiss demographic data from around 1888. The...
 For this exercise we will run a regression using Swiss demographic data from around 1888. The sample is a cross-section of French speaking counties in Switzerland This data come with the R package datasets. The first step is to load the package into your current environment by typing the command libraryldatasets) in to the R console. This loads a number of datasets including one called swiss. Type help/swiss) in the console for additional details. The basic variable definitions are as...
 2. You are a consultant hired by the city government of a community considering the development of a light rail mass transit system. The data you have to help you make recommendations to the city are given in the table of data on similar mass transit systems in 11 different U.S. cities shown below (USA Today - 12/28/04): Stations 38 14 53 City Atlanta Baltimore Boston Chicago Cleveland Los Angeles Miami New York Philadelphia San Francisco Washington 144 18 16...
 PLEASE ANSWER ALL parts .
IF YOU CANT ANSWER ALL, KINDLY ANSWER PART (E) AND
PART(F)
FOR PART (E) THE REGRESSION MODEL IS ALSO GIVE AT THE
END.
REGRESSION MODEL:
We will be returning to the mtcars dataset, last seen in assignment 4. The dataset mtcars is built into R. It was extracted from the 1974 Motor Trend US magazine, and comcaprises fuel consumption and 10 aspects of automobile design and performance for 32 automobiles (1973-74 models). You can find...
PLEASE ANSWER ALL parts .
IF YOU CANT ANSWER ALL, KINDLY ANSWER PART (E) AND
PART(F)
FOR PART (E) THE REGRESSION MODEL IS ALSO GIVE AT THE
END.
REGRESSION MODEL:
We will be returning to the mtcars dataset, last seen in assignment 4. The dataset mtcars is built into R. It was extracted from the 1974 Motor Trend US magazine, and comcaprises fuel consumption and 10 aspects of automobile design and performance for 32 automobiles (1973-74 models). You can find...
 Situation (note: Problem 2 is not linked with Problem 1): Assuming the design flow rate of raw wastewater to be treated is 20 MGD in the design year, the dissolved BODs is 380 mg/L, and SS is 360 mg/L. The wastewater generated by the sludge treatment process is about 4 MGD with the dissolved BODs being 1800 mg/L, and SS being 1200 mg/L, and will be returned to the wet well in the pumping station at the beginning of the...
 For this exercise we will run a regression using Swiss demographic data from around 1888. The sample is a cross-section of French speaking counties in Switzerland This data come with the R package datasets. The first step is to load the package into your current environment by typing the command libraryldatasets) in to the R console. This loads a number of datasets including one called swiss. Type help/swiss) in the console for additional details. The basic variable definitions are as...
Most questions answered within 3 hours.
-
An entomologist discovers a dung beetle rolling a ball of dung
along the ground, and decides...
asked 3 minutes ago -
Humans have used horses for transportation for millions of
years. Therefore, they will use horses for...
asked 1 hour ago -
The following are the Jensen Corporation's unit costs of making
and selling an item at a...
asked 2 hours ago -
Does direct Medicare reimbursement of Advanced practice nurses
increase access to their services?
asked 3 hours ago -
List and explain why a company would choose to use a
published
compensation survey vs. creating...
asked 3 hours ago -
A discrete random variable X can take values from 1 to 10. Find
the variance of...
asked 3 hours ago -
The primary financial goal of a corporation is to maximize:
shareholders wealth.
earnings per share.
stock...
asked 3 hours ago -
determine whether the vectors u=(1,2,3,), v=(-2,1,0) and
w=(1,0,1) are linearly dependent or independent.
asked 3 hours ago -
python
Define a function called print_values which takes a dictionary
object as a parameter. The function...
asked 4 hours ago -
In Chapter 1 you created a program named Triangle in
which you displayed a seven-line triangle...
asked 4 hours ago -
Research question: What are the differences between separately
stated and non separately stated transactions in an...
asked 5 hours ago -
By using Arduino write a code that connects two LEDs to two
push-buttons. Each button controls...
asked 6 hours ago