
Homework Answers


Add Answer to:
Of n1 randomly selected male smokers, X1 smoked filter cigarettes, whereas of n2 randomly selected female...
Of n randomly selected engineering students at ASU, X1 owned an HP calculator, and ofn2 randomly...
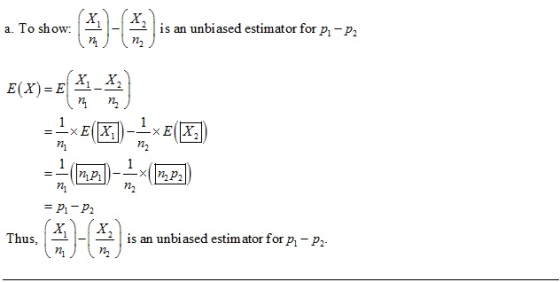
 Of n randomly selected engineering students at ASU, X1 owned an HP calculator, and ofn2 randomly selected engineering students at Virginia Tech, X2 owned an HP calculator. Let p, and p2 be the probability that randomly selected ASU and Virginia Tech engineering students, respectively, own HP calculators (a) Model the two random variables X1, X2 as a reasonable random variable with appropriate parameters (b) Show that an unbiased estimator for Ф-Pa) is (X1/nl-X2/n2) (c) What is the standard error of...
Let N1=40, X1=30, N2=40 and X2=20 Calculate the test statistic ZSTAT based on the difference P1-P2...
Let N1=40, X1=30, N2=40 and X2=20 Calculate the test statistic ZSTAT based on the difference P1-P2 the test statistic, ZSTAT is what?
Construct a confidence interval for p1−p2 at the given level of confidence. x1=365, n1=503, x2=447, n2=558,...
Construct a confidence interval for p1−p2 at the given level of confidence. x1=365, n1=503, x2=447, n2=558, 95% confidence
Construct a confidence interval for p1−p2 at the given level of confidence. x1=365 n1=536 x2=435 n2=593...
Construct a confidence interval for p1−p2 at the given level of confidence. x1=365 n1=536 x2=435 n2=593 90% confidence The researchers are (blank) % confident the difference between the two population proportions, p1−p2, is between (blank) and (blank)
The weights of randomly selected 5 female students and 5 male students are given by the...
The weights of randomly selected 5 female students and 5 male students are given by the following:weights for male students:160,165,152,158,178weights for female students:169,154,158,156,162.Let the weight distributions of male and female students follow N(μ1,σ1) and N(μ2,σ2)respectively.• TestH0:σ1=σ2vs.H1:σ16=σ2at 5% level of significance. UseF4,4,0.025= 0.10F4,4,0.975= 9.60.
Independent random samples of n1 = 900 and n2 = 780 observations were selected from binomial...
Independent random samples of n1 = 900 and n2 = 780 observations were selected from binomial populations 1 and 2, and x1 = 336 and x2 = 378 successes were observed. (a) Find a 90% confidence interval for the difference (p1 − p2) in the two population proportions. (Round your answers to three decimal places.) What assumptions must you make for the confidence interval to be valid? (Select all that apply.) 1. independent samples 2. random samples 3. n1 +...
The weights of randomly selected 5 female students and 5 male students are given by the...
The weights of randomly selected 5 female students and 5 male students are given by the following: weights for male students:160,165,152,158,178 weights for female students:169,154,158,156,162. Let the weight distributions of male and female students follow N(μ1,σ1) and N(μ2,σ2) respectively. • Test H0 : u1 = μ2 VS u1 cant equal u2 at 5% level of significance. Use P(t8>2.30) =0.025. (5 points)
The weights of randomly selected 5 female students and 5 male students are given bythe following:weights...
The weights of randomly selected 5 female students and 5 male students are given bythe following:weights for male students:160,165,152,158,178weights for female students:169,154,158,156,162.Let the weight distributions of male and female students follow N(μ1,σ1) and N(μ2,σ2)respectively. TestH0:μ1=μ2vs.μ16=μ2at 5% level of significance. UseP(t8>2.30) =0.025. (5 points)
Independent random samples of size n1=38 and n2=86 observations, were selected from two populations. The samples...
Independent random samples of size n1=38 and n2=86 observations, were selected from two populations. The samples from populations 1 and 2 produced x1=18 and x2=13 successes, respectively. Define p1 and p2 to be the proportion of successes in populations 1 and 2, respectively. We would like to test the following hypotheses: H0:p1=p2 versus H1:p1≠p2 (a)To test H0 versus H1, which inference procedure should you use? A. Two-sample z procedure B. One-sample z procedure C. One-sample t procedure D. Two-sample t...
Construct a 95% confidence interval for p1 - p2. The sample statistics listed below are from independent samples. Sample statistics: n1 = 100, x1 = 35, n2 = 60, x2 = 50 A) (-0.141, 0.208) B) (-0.871,...
Construct a 95% confidence interval for p1 - p2. The sample statistics listed below are from independent samples. Sample statistics: n1 = 100, x1 = 35, n2 = 60, x2 = 50 A) (-0.141, 0.208) B) (-0.871, 0.872) C) (-2.391, 3.112) D) (-1.341, 1.781)
 Of n randomly selected engineering students at ASU, X1 owned an HP calculator, and ofn2 randomly selected engineering students at Virginia Tech, X2 owned an HP calculator. Let p, and p2 be the probability that randomly selected ASU and Virginia Tech engineering students, respectively, own HP calculators (a) Model the two random variables X1, X2 as a reasonable random variable with appropriate parameters (b) Show that an unbiased estimator for Ф-Pa) is (X1/nl-X2/n2) (c) What is the standard error of...
Most questions answered within 3 hours.
-
Given the line notation, identify the anodic and
cathodic reactions and overall reaction:
Ag(s)| AgCl(s) |...
asked 19 minutes ago -
The money raised and spent (both in millions of dollars) by
all congressional campaigns for 8...
asked 22 minutes ago -
Annual salaries for employees in a large company are
approximately normally distributed with a mean of...
asked 31 minutes ago -
1. Lifetimes of a certain brand of lightbulbs is known to follow
a right-skewed distribution with...
asked 31 minutes ago -
The gravitational field
F(x,y,z) =cx /(x2 + y2 + z2)3/2 e1+ cy /(x2 + y2 +...
asked 29 minutes ago -
Below is an abstract from the following paper published in
Frontiers in Cell and Developmental Biology....
asked 32 minutes ago -
Company A is assigned $200,000 of goodwill arising from a recent
business combination. The current carrying...
asked 38 minutes ago -
Write any individual Class A IP address below. It cannot be
non-routable address. Include the subnet...
asked 39 minutes ago -
Coronado Industries had January 1 inventory of $301000 when it
adopted dollar-value LIFO. During the year,...
asked 49 minutes ago -
The cable supporting a 2145-kg elevator has a maximum strength
of 2.18×10⁴ N.
a) What maximum...
asked 58 minutes ago -
Find the critical value(s) and rejection region(s) for a
two-tailed chi-square test with a sample size...
asked 1 hour ago -
One of your experts gave me an answer of $7.36 but there are
many different answers...
asked 1 hour ago