
Homework Answers
Solution:
Part b)
Given:
n = 240

s = 3.1
confidence level = c = 95%
Use following steps in TI 84 plus calculator:
Press STAT and select TESTS
Under TESTS select T-Interval.
Under T interval ,select Stats
Under Stats enter number:
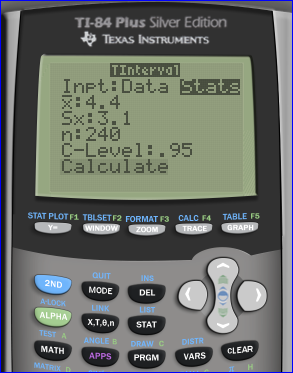
Click on Calculate and press Enter

( 4.0058 , 4.7942)
Round answer to one decimal places, we get:
(4.0 , 4.8)
thus
A 95% confidence interval is: ( 4.0 , 4.8 ).
Add Answer to:
For a certain survey, software reports the results shown below for responses on the number of...
A survey of 2553 people were placed in categorias ordered in terms of degree of liberalism...
 A survey of 2553 people were placed in categorias ordered in terms of degree of liberalism or conservation. The observations had a man of 5.01, and a standard deviation of 1.92. Staristical analysis greatest statistic of 0.26, and a P-value testing Ho -5.00 against 500 of 0.7940. Suppose that the sample mean and sample standard deviation were from a sample size of only 30, wher than 2563 a. Find the best statistic Pound to the nearest hundredth as needed) b....
A newspaper reported on the results of an opinion poll in which adults were asked what...
 A newspaper reported on the results of an opinion poll in which adults were asked what one thing they are most likely to do when they are home sick with a cold or the flu. In the survey, 62% said that they are most likely to sleep and 17% said that they would watch television. Although the sample size was not reported, typically opinion polls include approximately 1,000 randomly selected respondents a. Assuming a sample size of 1,000 for this...
A research team is interested in the effectiveness of hypnosis in reducing pain. The responses from...
A research team is interested in the effectiveness of hypnosis in reducing pain. The responses from 8 randomly selected patients before and after hypnosis are recorded in the table below (higher values indicate more pain). Construct a 90% confidence interval for the true mean difference in pain after hypnosis. Perceived pain levels 'Pre' and 'Post' hypnosis for 8 subjects Pre 11.3 8.1 8.4 11.1 13.4 15.1 10.6 10.1 Post 9.9 9.1 3.1 8.5 7.0 9.9 10.9 7.7 Difference a) Fill...
1. (15) Two samples of girls aged 6 and 7 are with the results shown below....
 1. (15) Two samples of girls aged 6 and 7 are with the results shown below. given the Wide Range Achievement Test, Age 6 Age 7 Sample Size 11 15 Mean Score 42 51 Standard Deviation 8 Construct a 95% confidence interval for the difference in mean scores for the two age groups. (10 pts) a. b. Based on the interval from part A, do the test scores differ between the two age groups? Explain your answer. (5 pts)
1....
1. (15) Two samples of girls aged 6 and 7 are with the results shown below. given the Wide Range Achievement Test, Age 6 Age 7 Sample Size 11 15 Mean Score 42 51 Standard Deviation 8 Construct a 95% confidence interval for the difference in mean scores for the two age groups. (10 pts) a. b. Based on the interval from part A, do the test scores differ between the two age groups? Explain your answer. (5 pts)
1....
The 2010 General Social Survey asked 1,259 US residents: "Do you think the use of marijuana...
The 2010 General Social Survey asked 1,259 US residents: "Do you think the use of marijuana should be made legal, or not?" 48% of the respondents said it should be made legal. 1. The value 48% is a... A. population parameter B. sample statistic 2. Construct a 95% confidence interval for the proportion of US residents who think marijuana should be made legal, and interpret it in the context of the data. Round your results to four decimal places. (...
A newspaper reported on the results of an opinion poll in which adults were asked what...
 A newspaper reported on the results of an opinion poll in which adults were asked what one thing they are most likely to do when they are home sick with a cold or the flu. In the survey, 61% said that they are most likely to sleep and 18% said that they would watch television. Although the sample size was not reported, typically opinion polls include approximately 1,000 randomly selected respondents. a. Assuming a sample size of 1,000 for this...
A newspaper reported on the results of an opinion poll in which adults were asked what...
 A newspaper reported on the results of an opinion poll in which adults were asked what one thing they are most likely to do when they are home sick with a cold or the flu. In the survey, 64% said that they are most likely to sleep and 13% said that they would watch television. Although the sample size was not reported, typically opinion polls include approximately 1,000 randomly selected respondents. a. Assuming a sample size of 1,000 for this...
Use technology and the given confidence level and sample data to find the confidence interval for...
 Use technology and the given confidence level and sample data to find the confidence interval for the population mean u. Assume that the population does not exhibit a normal distribution. 95% confidence Weight lost on a diet **3.0 kg n=51 s5.4 kg nd Master- What is the confidence interval for the population mean u? Okg u kg (Round to one decimal place as needed.) Is the confidence interval affected by the fact that the data appear to be from a...
5. Normally the leaves of the Mimosa pudica are horizontal. However, if one of them is...
 5. Normally the leaves of the Mimosa pudica are horizontal. However, if one of them is touched lightly, the leaflets will fold. It is reported that y, the true mean time from touch to complete closure is 3.0s. An experiment is run to test this value. A random sample of size observations on the elapsed time (seconds) from touch to complete closure yields the following data: 3.2, 4.4, 3.5, 2.9, 4.2, 2.8. Assume the population distribution of elapsed times is...
A market researcher for a consumer electronics company wants to study the television viewing habits of...
A market researcher for a consumer electronics company wants to study the television viewing habits of residents of a particular area. A random sample of 40 respondents is selected, and each respondent is instructed to keep a detailed record of all television viewing in a particular week. The results are as follows: • Viewing time per week: Xbar = 15.3 hours, S = 3.8 hours. • 27 respondents watch the evening news on at least three weeknights. Construct a 95%...
 A survey of 2553 people were placed in categorias ordered in terms of degree of liberalism or conservation. The observations had a man of 5.01, and a standard deviation of 1.92. Staristical analysis greatest statistic of 0.26, and a P-value testing Ho -5.00 against 500 of 0.7940. Suppose that the sample mean and sample standard deviation were from a sample size of only 30, wher than 2563 a. Find the best statistic Pound to the nearest hundredth as needed) b....
 A newspaper reported on the results of an opinion poll in which adults were asked what one thing they are most likely to do when they are home sick with a cold or the flu. In the survey, 62% said that they are most likely to sleep and 17% said that they would watch television. Although the sample size was not reported, typically opinion polls include approximately 1,000 randomly selected respondents a. Assuming a sample size of 1,000 for this...
 1. (15) Two samples of girls aged 6 and 7 are with the results shown below. given the Wide Range Achievement Test, Age 6 Age 7 Sample Size 11 15 Mean Score 42 51 Standard Deviation 8 Construct a 95% confidence interval for the difference in mean scores for the two age groups. (10 pts) a. b. Based on the interval from part A, do the test scores differ between the two age groups? Explain your answer. (5 pts)
1....
1. (15) Two samples of girls aged 6 and 7 are with the results shown below. given the Wide Range Achievement Test, Age 6 Age 7 Sample Size 11 15 Mean Score 42 51 Standard Deviation 8 Construct a 95% confidence interval for the difference in mean scores for the two age groups. (10 pts) a. b. Based on the interval from part A, do the test scores differ between the two age groups? Explain your answer. (5 pts)
1....
 A newspaper reported on the results of an opinion poll in which adults were asked what one thing they are most likely to do when they are home sick with a cold or the flu. In the survey, 61% said that they are most likely to sleep and 18% said that they would watch television. Although the sample size was not reported, typically opinion polls include approximately 1,000 randomly selected respondents. a. Assuming a sample size of 1,000 for this...
 A newspaper reported on the results of an opinion poll in which adults were asked what one thing they are most likely to do when they are home sick with a cold or the flu. In the survey, 64% said that they are most likely to sleep and 13% said that they would watch television. Although the sample size was not reported, typically opinion polls include approximately 1,000 randomly selected respondents. a. Assuming a sample size of 1,000 for this...
 Use technology and the given confidence level and sample data to find the confidence interval for the population mean u. Assume that the population does not exhibit a normal distribution. 95% confidence Weight lost on a diet **3.0 kg n=51 s5.4 kg nd Master- What is the confidence interval for the population mean u? Okg u kg (Round to one decimal place as needed.) Is the confidence interval affected by the fact that the data appear to be from a...
 5. Normally the leaves of the Mimosa pudica are horizontal. However, if one of them is touched lightly, the leaflets will fold. It is reported that y, the true mean time from touch to complete closure is 3.0s. An experiment is run to test this value. A random sample of size observations on the elapsed time (seconds) from touch to complete closure yields the following data: 3.2, 4.4, 3.5, 2.9, 4.2, 2.8. Assume the population distribution of elapsed times is...
Most questions answered within 3 hours.
-
On the night of April 18, 1775, a signal was to be sent from the
Old...
asked 1 minute from now -
could you please help me to explain the nmr splitting
integration and chemical shift and assignment...
asked 3 minutes ago -
Organizations may have only a few products or many products in a
product line. Consider Campbell...
asked 7 minutes ago -
A
29.0 cm diameter coil consists of 23 turns of cylindrical copper
wire 2.00 mm in...
asked 9 minutes ago -
(1) Write the net ionic equation for the reaction that occurs
when equal volumes of 0.191...
asked 15 minutes ago -
Q1
Two of your friends each received the results of their
first midterm exam this term....
asked 26 minutes ago -
A 0.500-kg object, suspended from an ideal spring of spring
constant 30.2 N/m, is oscillating vertically....
asked 24 minutes ago -
Please help and show work. I keep getting the wrong answers for
these problems
1. Cell...
asked 21 minutes ago -
If there is a SNP in the read with respect to the
reference genome, how would a...
asked 23 minutes ago -
Early black-and-white television sets used an electron beam to
draw a picture on the screen. The...
asked 26 minutes ago -
What is the standard error of M (denoted as
σM ) ?
Options:
The mean of...
asked 50 minutes ago -
Explain the role of n, the sample size, in determining the size
of a generated confidence...
asked 39 minutes ago