


Homework Answers
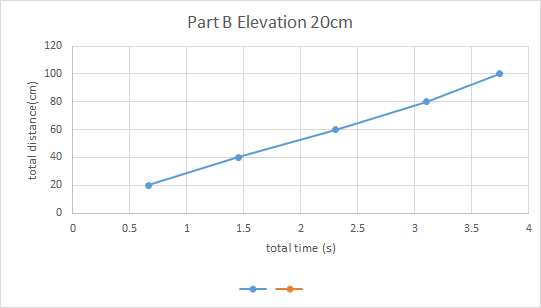


1) For motion with constant Velocity same distance changes with same interval of time.
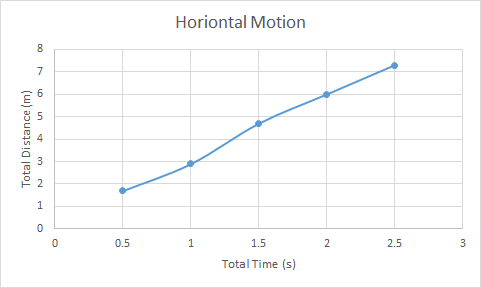
2) Slope of distance time graph represents Velocity of bodyin particular Direction.
3) Velocity for elevatation 40 is greater than Velocity for elevation for 20 cm becasue slope of elevation 40 graph is more.
4) For accelerated motion unequal distance changes with equal interval of time.
5) By Accelerated graph we can calculate instantaneous Velocity at particular time and we can observe Velocity change for overall motion.
Add Answer to:
Lab 7 Data Sheet: Analyzing Motion fill them in Name: Date: Time & Day of lecture:...
1. The following data set was taken from the motion of an object. The object started...
 1. The following data set was taken from the motion of an object. The object started with an initial velocity and accelerated uniformly. The instantaneous velocity of the object was measured for 15 different values of the time. t (sec) v(m/s) 1.20 1.40 1.60 1.80 2.00 t (sec) 2.20 2.40 2.60 2.80 3.00 v (m/s) 1.62 1.74 1.86 1.98 2.10 t (sec) v (m/s) 0.200 0.420 0.4000.540 0.6000.660 0.8000.780 1.0000.900 1.02 1.14 1.26 1.38 1.50 a). Using the graph paper...
DATA TABLE 4 Purpose: To practice analyzing data Time t Distance (m) Optional) 0 0.50 0.75...
 DATA TABLE 4 Purpose: To practice analyzing data Time t Distance (m) Optional) 0 0.50 0.75 1.00 1.25 0 0 3.1 2.8 4.8 4. 7.4 7.8 2.8 2.5 4.7 56 2.6 4.8 8.2 3.2 30 7.9 7.5 36 1.56 (d (e) The equation of motion for an object in free fall starting from rest is y gf, where g is the acceleration due to gravity. This is the equation of a parabola, which has the general form y = ar...
O Part l: Data Complete Table 1. Record all data to three decimal places (e.g., 4.000...
 O Part l: Data Complete Table 1. Record all data to three decimal places (e.g., 4.000 or 6.325 or 0.000). Do not include units in your answen Table 1 Initial Settings At Time Calculated Position Describe Position (x) vs. Time gra 20 x-0.00 m Vel vs. Time gra v 5.00 m/s | 40 | a = 0.00 m/s2 a) vs. Time graph 50 Position (x) vs, Time gra 20 40 x 0.00 m v = 10.0 m/s | 40 |...
Fill out the table and do parts 2 and 3 Table 1.1: Behr free-fall pos/ time...
 Fill out the table and do parts 2 and 3
Table 1.1: Behr free-fall pos/ time data. dot # 1 time (s) | position (cm) velocity (cm/s) 0 60 2/60 60 10.00 11.88 14.10 16.50 and 2, (14.10 - 10.00)em i02- -30(410)cm1/s#123cn/s and between dots 1 and 3. Place them in the table at the times they are the instantaneous velocity: for example. the time at which the average velocity between dots 0 and 2 is the instantaneous velocity is...
Fill out the table and do parts 2 and 3
Table 1.1: Behr free-fall pos/ time data. dot # 1 time (s) | position (cm) velocity (cm/s) 0 60 2/60 60 10.00 11.88 14.10 16.50 and 2, (14.10 - 10.00)em i02- -30(410)cm1/s#123cn/s and between dots 1 and 3. Place them in the table at the times they are the instantaneous velocity: for example. the time at which the average velocity between dots 0 and 2 is the instantaneous velocity is...
Graphing Data Report . Sheet Report Sheet Graphing Data Data Length (cm) Total time (sec) Period...
 Graphing Data Report . Sheet Report Sheet Graphing Data Data Length (cm) Total time (sec) Period (sec) 0 10 20 40 60 80 100 Slope of L vs. T plot: Intercept of L vs. T plot: Questions 1) Calculation of g (include all steps) Percent error from 980 cm/s (show work) 2) Length of a 1.00 sec simple pendulum Show work, or provide an explanation for how the length was determined
Phys2425 PRE-LAB FORM LINEAR MOTION: MEASURING g VALUE Using the given data, draw velocity versus time...
 Phys2425 PRE-LAB FORM LINEAR MOTION: MEASURING g VALUE Using the given data, draw velocity versus time and find the slope. 0.0790.1 1.49 173 48 0.045 V(m/s) 1.11 1.79 2.07 van's phy 2. If we say that one object is under free fall motion, what do we mean in sics? A dropping ball initially at rest falls 1.5m. Calculate (a) the traveling time of the ball and (b) its velocity just before reaching the ground 3.
need help on this graph Physies 195 - Straight-line kinematics Data: Dot period=1/10s: the time interval...
 need help on this graph
Physies 195 - Straight-line kinematics Data: Dot period=1/10s: the time interval between dots is 0.100 corrected values] 15 16 Xc (cm) te(s) 6 7 0 12 3 14. X(cm) t(s) đa (cm) | V (cm/s) 0 0 2.18 0.1002 .182 .0 4.890.200 12.7127.00 2. 5 0.30 3.67 36.70 12.88 o.quo 4.32 430 f 9.95 O S 10 .20 zich were 1 1 tbalo 30,56 38.0 74.50 46.43 0.900 8.8 84.43 55-25 88.00 1101.30 65.39 1.100...
need help on this graph
Physies 195 - Straight-line kinematics Data: Dot period=1/10s: the time interval between dots is 0.100 corrected values] 15 16 Xc (cm) te(s) 6 7 0 12 3 14. X(cm) t(s) đa (cm) | V (cm/s) 0 0 2.18 0.1002 .182 .0 4.890.200 12.7127.00 2. 5 0.30 3.67 36.70 12.88 o.quo 4.32 430 f 9.95 O S 10 .20 zich were 1 1 tbalo 30,56 38.0 74.50 46.43 0.900 8.8 84.43 55-25 88.00 1101.30 65.39 1.100...
Part b & c Name Date Data Sheet Experiment 21: Ballistic Pendulum A. The Ballistic Pendulum...
 Part b & c
Name Date Data Sheet Experiment 21: Ballistic Pendulum A. The Ballistic Pendulum Mass of ball m- Mass of pendulum M,-0.23 k Trial h2 (m) h1 (m) 0 0:142 Average heighthORSm Initial velocity of ball2ms 30 3 B. The Energy Lost in a Perfectly Inelastic Collision mb 0.0699 Final velocity of ball and pendalam aer the collision m/s Initial Kinétic Energy (J) ie Eaergy ) Kinetic Energy Lost AB a) C.The Determination of the Velocity of the...
Part b & c
Name Date Data Sheet Experiment 21: Ballistic Pendulum A. The Ballistic Pendulum Mass of ball m- Mass of pendulum M,-0.23 k Trial h2 (m) h1 (m) 0 0:142 Average heighthORSm Initial velocity of ball2ms 30 3 B. The Energy Lost in a Perfectly Inelastic Collision mb 0.0699 Final velocity of ball and pendalam aer the collision m/s Initial Kinétic Energy (J) ie Eaergy ) Kinetic Energy Lost AB a) C.The Determination of the Velocity of the...
Answer 1-7 please. Distance v. time Lab part 1 continued starting points and different movements (any...
 Answer 1-7 please.
Distance v. time Lab part 1 continued starting points and different movements (any combination of forward, backward, and standing still) staying within the 1 m and 4 m marks 6. Repeat steps Sa-Se four times, for a total of five graphs and descriptions. Use different Snf Dist. (ml Time (s) 5mp hi valk"5ls5c.edvalk d."So walk 3m to 1Lm 2m to On Ons 3ng Om to 3m Answer the following questions (use a separate sheet of paper if...
Answer 1-7 please.
Distance v. time Lab part 1 continued starting points and different movements (any combination of forward, backward, and standing still) staying within the 1 m and 4 m marks 6. Repeat steps Sa-Se four times, for a total of five graphs and descriptions. Use different Snf Dist. (ml Time (s) 5mp hi valk"5ls5c.edvalk d."So walk 3m to 1Lm 2m to On Ons 3ng Om to 3m Answer the following questions (use a separate sheet of paper if...
One member of your group owns a sports car and has recorded some data for the straight-line motion of the car
One member of your group owns a sports car and has recorded some data for the straight-line motion of the car. The figure below shows part of the velocity data for the motion.(a) Determine the total distance (in m) the car traveled in the 50-s interval by evaluating the area under the red-brown graph line.(b) What distance (in m) does the car travel between the times t = 10 s and t = 40 s? (c) Draw a graph of its...
 1. The following data set was taken from the motion of an object. The object started with an initial velocity and accelerated uniformly. The instantaneous velocity of the object was measured for 15 different values of the time. t (sec) v(m/s) 1.20 1.40 1.60 1.80 2.00 t (sec) 2.20 2.40 2.60 2.80 3.00 v (m/s) 1.62 1.74 1.86 1.98 2.10 t (sec) v (m/s) 0.200 0.420 0.4000.540 0.6000.660 0.8000.780 1.0000.900 1.02 1.14 1.26 1.38 1.50 a). Using the graph paper...
 DATA TABLE 4 Purpose: To practice analyzing data Time t Distance (m) Optional) 0 0.50 0.75 1.00 1.25 0 0 3.1 2.8 4.8 4. 7.4 7.8 2.8 2.5 4.7 56 2.6 4.8 8.2 3.2 30 7.9 7.5 36 1.56 (d (e) The equation of motion for an object in free fall starting from rest is y gf, where g is the acceleration due to gravity. This is the equation of a parabola, which has the general form y = ar...
 O Part l: Data Complete Table 1. Record all data to three decimal places (e.g., 4.000 or 6.325 or 0.000). Do not include units in your answen Table 1 Initial Settings At Time Calculated Position Describe Position (x) vs. Time gra 20 x-0.00 m Vel vs. Time gra v 5.00 m/s | 40 | a = 0.00 m/s2 a) vs. Time graph 50 Position (x) vs, Time gra 20 40 x 0.00 m v = 10.0 m/s | 40 |...
 Fill out the table and do parts 2 and 3
Table 1.1: Behr free-fall pos/ time data. dot # 1 time (s) | position (cm) velocity (cm/s) 0 60 2/60 60 10.00 11.88 14.10 16.50 and 2, (14.10 - 10.00)em i02- -30(410)cm1/s#123cn/s and between dots 1 and 3. Place them in the table at the times they are the instantaneous velocity: for example. the time at which the average velocity between dots 0 and 2 is the instantaneous velocity is...
Fill out the table and do parts 2 and 3
Table 1.1: Behr free-fall pos/ time data. dot # 1 time (s) | position (cm) velocity (cm/s) 0 60 2/60 60 10.00 11.88 14.10 16.50 and 2, (14.10 - 10.00)em i02- -30(410)cm1/s#123cn/s and between dots 1 and 3. Place them in the table at the times they are the instantaneous velocity: for example. the time at which the average velocity between dots 0 and 2 is the instantaneous velocity is...
 Graphing Data Report . Sheet Report Sheet Graphing Data Data Length (cm) Total time (sec) Period (sec) 0 10 20 40 60 80 100 Slope of L vs. T plot: Intercept of L vs. T plot: Questions 1) Calculation of g (include all steps) Percent error from 980 cm/s (show work) 2) Length of a 1.00 sec simple pendulum Show work, or provide an explanation for how the length was determined
 Phys2425 PRE-LAB FORM LINEAR MOTION: MEASURING g VALUE Using the given data, draw velocity versus time and find the slope. 0.0790.1 1.49 173 48 0.045 V(m/s) 1.11 1.79 2.07 van's phy 2. If we say that one object is under free fall motion, what do we mean in sics? A dropping ball initially at rest falls 1.5m. Calculate (a) the traveling time of the ball and (b) its velocity just before reaching the ground 3.
 need help on this graph
Physies 195 - Straight-line kinematics Data: Dot period=1/10s: the time interval between dots is 0.100 corrected values] 15 16 Xc (cm) te(s) 6 7 0 12 3 14. X(cm) t(s) đa (cm) | V (cm/s) 0 0 2.18 0.1002 .182 .0 4.890.200 12.7127.00 2. 5 0.30 3.67 36.70 12.88 o.quo 4.32 430 f 9.95 O S 10 .20 zich were 1 1 tbalo 30,56 38.0 74.50 46.43 0.900 8.8 84.43 55-25 88.00 1101.30 65.39 1.100...
need help on this graph
Physies 195 - Straight-line kinematics Data: Dot period=1/10s: the time interval between dots is 0.100 corrected values] 15 16 Xc (cm) te(s) 6 7 0 12 3 14. X(cm) t(s) đa (cm) | V (cm/s) 0 0 2.18 0.1002 .182 .0 4.890.200 12.7127.00 2. 5 0.30 3.67 36.70 12.88 o.quo 4.32 430 f 9.95 O S 10 .20 zich were 1 1 tbalo 30,56 38.0 74.50 46.43 0.900 8.8 84.43 55-25 88.00 1101.30 65.39 1.100...
 Part b & c
Name Date Data Sheet Experiment 21: Ballistic Pendulum A. The Ballistic Pendulum Mass of ball m- Mass of pendulum M,-0.23 k Trial h2 (m) h1 (m) 0 0:142 Average heighthORSm Initial velocity of ball2ms 30 3 B. The Energy Lost in a Perfectly Inelastic Collision mb 0.0699 Final velocity of ball and pendalam aer the collision m/s Initial Kinétic Energy (J) ie Eaergy ) Kinetic Energy Lost AB a) C.The Determination of the Velocity of the...
Part b & c
Name Date Data Sheet Experiment 21: Ballistic Pendulum A. The Ballistic Pendulum Mass of ball m- Mass of pendulum M,-0.23 k Trial h2 (m) h1 (m) 0 0:142 Average heighthORSm Initial velocity of ball2ms 30 3 B. The Energy Lost in a Perfectly Inelastic Collision mb 0.0699 Final velocity of ball and pendalam aer the collision m/s Initial Kinétic Energy (J) ie Eaergy ) Kinetic Energy Lost AB a) C.The Determination of the Velocity of the...
 Answer 1-7 please.
Distance v. time Lab part 1 continued starting points and different movements (any combination of forward, backward, and standing still) staying within the 1 m and 4 m marks 6. Repeat steps Sa-Se four times, for a total of five graphs and descriptions. Use different Snf Dist. (ml Time (s) 5mp hi valk"5ls5c.edvalk d."So walk 3m to 1Lm 2m to On Ons 3ng Om to 3m Answer the following questions (use a separate sheet of paper if...
Answer 1-7 please.
Distance v. time Lab part 1 continued starting points and different movements (any combination of forward, backward, and standing still) staying within the 1 m and 4 m marks 6. Repeat steps Sa-Se four times, for a total of five graphs and descriptions. Use different Snf Dist. (ml Time (s) 5mp hi valk"5ls5c.edvalk d."So walk 3m to 1Lm 2m to On Ons 3ng Om to 3m Answer the following questions (use a separate sheet of paper if...
Most questions answered within 3 hours.
-
Water has significant IMF, which result in many of its unique
properties—high boiling point relative to...
asked 5 minutes ago -
If X is a binomial random variable with n = 8
and p = 0.2, the...
asked 10 minutes ago -
Seasonal or cyclical variation in a time-series model…
---exhibits irregular
variation that can be accounted for...
asked 11 minutes ago -
Please use Barney's VRIO framework of analysis to evaluate a
firm's competencies. Please choose a specific...
asked 24 minutes ago -
Where would you expect to have diabetes contributing to the most
DALYs in 2035, according to...
asked 25 minutes ago -
1.) Major league baseball salaries averaged $1.5 million with a
standard deviation of $1 million in...
asked 34 minutes ago -
A hedge fund is holding a three-year,
$10 million face value 6 percent annual coupon bond...
asked 46 minutes ago -
The focal length of a makeup (concave) mirror is 0.48 m. What
magnification does this mirror...
asked 50 minutes ago -
TRUE/FALSE
Long-lived assets that are tangible in nature, used in the
operations of the business, and...
asked 50 minutes ago -
A dragon biologist is setting up an experimental population of
1000 individuals. In dragons, pointy crests...
asked 1 hour ago -
A uniform thin rod of length 0.851 m is hung from a horizontal
nail passing through...
asked 1 hour ago -
A 747 has a cruising speed of 235 m/s at a height of 10,700
meters. The...
asked 1 hour ago