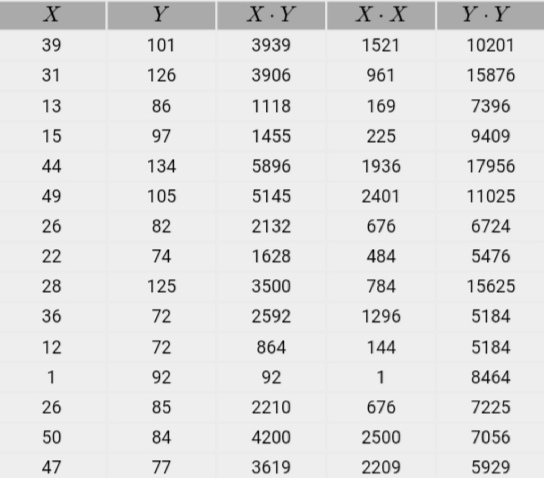
A student wants to see if the weight of a paperback book and the number of...
A student wants to see if the weight of a paperback book and the
number of pages in the book are related. She guesses that the
weight of the book will be a predictor of the number of pages it
has. She randomly sampled 15 books from the library, test her claim
at a 0.01 level of significance.
| weight in ounces | number of pages |
|---|---|
| 39 | 101 |
| 31 | 126 |
| 13 | 86 |
| 15 | 97 |
| 44 | 134 |
| 49 | 105 |
| 26 | 82 |
| 22 | 74 |
| 28 | 125 |
| 36 | 72 |
| 12 | 72 |
| 1 | 92 |
| 26 | 85 |
| 50 | 84 |
| 47 | 77 |
The correlation coefficient:
r= ____ (round to 3 decimal places)
The equation y=a+bx is: (round to 3 decimal places)
y= ___ + __ x
The hypotheses are:
H0:ρ=0H0:ρ=0 (no linear relationship)
HA:ρ≠0HA:ρ≠0 (linear relationship) (claim)
Since αα is 0.01 the critical value is -3.012 and 3.012
The test value is: (round to 3 decimal places)
The p-value is: (round to 3 decimal places)
The decision is to
- reject H0H0
- do not reject H0H0
Thus the final conclusion sentence is
- There is enough evidence to reject the claim that there is a linear relationship.
- There is not enough evidence to reject the claim that there is a linear relationship.
- There is enough evidence to support the claim that there is a linear relationship.
- There is not enough evidence to support the claim that there is a linear relationship.
Homework Answers


Add Answer to:
A student wants to see if the weight of a paperback book and the
number of...
A student wants to see if the number of times a book has been checked out...
 A student wants to see if the number of times a book has been
checked out of the library in the past year and the number of pages
in the book are related. She guesses that the number of times a
book has been checked out of the library in the past year will be a
predictor of the number of pages it has. She randomly sampled 11
books from the library, test her claim at a 0.01 level of...
A student wants to see if the number of times a book has been
checked out of the library in the past year and the number of pages
in the book are related. She guesses that the number of times a
book has been checked out of the library in the past year will be a
predictor of the number of pages it has. She randomly sampled 11
books from the library, test her claim at a 0.01 level of...
A recent publication states that the average closing cost for purchasing a new home is $7654....
A recent publication states that the average closing cost for purchasing a new home is $7654. A real estate agent believes the average closing cost is different than $7654. She selects 28 new home purchases and finds that the average closing costs are $8270 with a standard deviation of $183. Help her decide if she is correct by testing her claim at αα=0.01. The correct hypotheses would be: H0:μ≤$7654H0:μ≤$7654 HA:μ>$7654HA:μ>$7654 (claim) H0:μ≥$7654H0:μ≥$7654 HA:μ<$7654HA:μ<$7654 (claim) H0:μ=$7654H0:μ=$7654 HA:μ≠$7654HA:μ≠$7654 (claim) Since the level...
Use technology and a t-test to test the claim about the population mean i at the...
 Use technology and a t-test to test the claim about the population mean i at the given level of significance at using the given sample statistics. Assume the population is normally distributed Claim: H > 72; « = 0.05 Sample statistics: X = 73.7, 5 = 3.3, n = 26 What are the null and alternative hypotheses? Choose the correct answer below. O A. Ho: 272 OB. Ho: = 72 Hau<72 H:#72 OC. H: 72 OD. Ho: HS72 HA=72 HA...
distributed Use a t-test to test the claim about the population mean ji at the given...
 distributed Use a t-test to test the claim about the population mean ji at the given level of significance a using the given sample statistics. Assume the population is normally Claim: #26; a=0.10 Sample statistics: X = 26.5, s=4.3, n = 11 What are the null and alternative hypotheses? Choose the correct answer below O A. Ho +26 OB. Ho: 226 H, = 26 H <26 OCH p=26 OD. HY S 26 H, #26 H>26 What is the value of...
You are conducting a study to see if the accuracy rate for fingerprint identification is significantly...
You are conducting a study to see if the accuracy rate for fingerprint identification is significantly more than 0.88. You use a significance level of α=0.01α=0.01. H0:p=0.88H0:p=0.88 H1:p>0.88H1:p>0.88 You obtain a sample of size n=587 in which there are 528 successes. What is the test statistic for this sample? (Report answer accurate to three decimal places.) test statistic = What is the p-value for this sample? (Report answer accurate to four decimal places.) p-value = The p-value is... a) less...
The following table shows the weights (in pounds) and the number of hours slept in a...
 The following table shows the weights (in pounds) and the number of hours slept in a day by a random sample of infants. Test the claim that M+0. Use a =0.01. Then interpret the results in the context of the problem. If convenient, use technology to solve the problem Click the icon to view more information about hypothesis testing for slope. Weight, 8.1 102 9.8 72 6.9 112 10.9 14.90 Hours slept, y 14.8 14.6 14.1 14.3 13.8 13.1 13.9...
You are given the following summary statistics from a sample of 26 observations: (You may find...
You are given the following summary statistics from a sample of 26 observations: (You may find it useful to reference the appropriate table: chi-square table or F table) Mean 67.28 Standard Deviation 11.73 Skewness 1.11 Kurtosis 1.78 a. Using the Jarque-Bera test, specify the null and alternative hypotheses to determine whether or not the data are normally distributed. H0: S = 0 and K = 0; HA: S ≠ 0 and K ≠ 0 H0: S = 0 and K...
Data on the weights (lb) of the contents of cans of diet soda versus the contents of cans of the regular version of the soda is summarized to the right. Assume that the two samples are independent si...
 Data on the weights (lb) of the contents of cans of diet soda versus the contents of cans of the regular version of the soda is summarized to the right. Assume that the two samples are independent simple random samples selected from normally distributed populations, and do not assume that the population standard deviations are equal Complete parts (a) and (b) below. Use a 0.01 significance level for both parts. Diet Reqular μ2 26 0.81485 Ib 0.00755 lb 26 0.78439...
A publisher reports that 72% of their readers own a personal computer. A marketing executive wants...
A publisher reports that 72% of their readers own a personal computer. A marketing executive wants to test the claim that the percentage is actually over the reported percentage. A random sample of 380 found that 76% of the readers owned a personal computer. Is there sufficient evidence at the 0.01 level to support the executive's claim? Step 1 of 6: State the null and alternative hypotheses. Step 2 of 6: Find the value of the test statistic. Round your...
Use a y? tost to test the claim a <43 at the a=0.01 significance levol using...
 Use a y? tost to test the claim a <43 at the a=0.01 significance levol using sample statistics s = 40.9 and 21. Assume the population is normally distributed. Identify the null and alternative hypotheses. O A. Ho: > 43 Ho: 343 0 6 Ho: g = 43 H:02:43 OB. Mo: 0543 H: > 43 OD. Ho: 0243 H:<43 Identify the test statistic (Round to three decimal places as needed.) Identify the critical value(s). (Round to three decimal places as...
 A student wants to see if the number of times a book has been
checked out of the library in the past year and the number of pages
in the book are related. She guesses that the number of times a
book has been checked out of the library in the past year will be a
predictor of the number of pages it has. She randomly sampled 11
books from the library, test her claim at a 0.01 level of...
A student wants to see if the number of times a book has been
checked out of the library in the past year and the number of pages
in the book are related. She guesses that the number of times a
book has been checked out of the library in the past year will be a
predictor of the number of pages it has. She randomly sampled 11
books from the library, test her claim at a 0.01 level of...
 Use technology and a t-test to test the claim about the population mean i at the given level of significance at using the given sample statistics. Assume the population is normally distributed Claim: H > 72; « = 0.05 Sample statistics: X = 73.7, 5 = 3.3, n = 26 What are the null and alternative hypotheses? Choose the correct answer below. O A. Ho: 272 OB. Ho: = 72 Hau<72 H:#72 OC. H: 72 OD. Ho: HS72 HA=72 HA...
 distributed Use a t-test to test the claim about the population mean ji at the given level of significance a using the given sample statistics. Assume the population is normally Claim: #26; a=0.10 Sample statistics: X = 26.5, s=4.3, n = 11 What are the null and alternative hypotheses? Choose the correct answer below O A. Ho +26 OB. Ho: 226 H, = 26 H <26 OCH p=26 OD. HY S 26 H, #26 H>26 What is the value of...
 The following table shows the weights (in pounds) and the number of hours slept in a day by a random sample of infants. Test the claim that M+0. Use a =0.01. Then interpret the results in the context of the problem. If convenient, use technology to solve the problem Click the icon to view more information about hypothesis testing for slope. Weight, 8.1 102 9.8 72 6.9 112 10.9 14.90 Hours slept, y 14.8 14.6 14.1 14.3 13.8 13.1 13.9...
 Data on the weights (lb) of the contents of cans of diet soda versus the contents of cans of the regular version of the soda is summarized to the right. Assume that the two samples are independent simple random samples selected from normally distributed populations, and do not assume that the population standard deviations are equal Complete parts (a) and (b) below. Use a 0.01 significance level for both parts. Diet Reqular μ2 26 0.81485 Ib 0.00755 lb 26 0.78439...
 Use a y? tost to test the claim a <43 at the a=0.01 significance levol using sample statistics s = 40.9 and 21. Assume the population is normally distributed. Identify the null and alternative hypotheses. O A. Ho: > 43 Ho: 343 0 6 Ho: g = 43 H:02:43 OB. Mo: 0543 H: > 43 OD. Ho: 0243 H:<43 Identify the test statistic (Round to three decimal places as needed.) Identify the critical value(s). (Round to three decimal places as...
Most questions answered within 3 hours.
-
The University of
Texas recently reported that 43% of college students aged 18-24
would spend their...
asked 55 minutes ago -
The length of stay at a specific emergency department in
Phoenix, Arizona, in 2009 had a...
asked 11 minutes ago -
. Please give the mechanism for this type of problem. Step by
Step
The toxin that...
asked 14 minutes ago -
If you have a 1M stock solution and you want to dilute 1 :10
with water,...
asked 16 minutes ago -
In a load instruction, the effective address is obtained by
A) Retriving the address from a...
asked 16 minutes ago -
Use the following information to answer this question.
Windswept, Inc. 2017 Income Statement ($ in millions)...
asked 17 minutes ago -
A mutual fund salesperson has arranged to call on four people
tomorrow. Based on past experience...
asked 50 minutes ago -
Let the RV Y has the pdf
f ( y ) = 6 y ( 1...
asked 1 hour ago -
Question 12
Where should a copy of a private key should be placed so it is...
asked 19 minutes ago -
What is the entropy change to the surroundings when 1 mol of ice
melts in someone's...
asked 39 minutes ago -
Pt1
An electrochemical cell is set up at 25°C based on the overall
reaction represented by...
asked 45 minutes ago -
Explain traveling wave theory. Explain how the peaking of the
wave leads to action potentials and...
asked 36 minutes ago