Block Commodities has gathered the following information concerning rock salt deliveries (tons) to its clients, which it believes are highly seasonal:
1. Block Commodities has gathered the following information concerning rock salt deliveries (tons) to its clients, which it believes are highly seasonal:
Month | Year 1 | Year 2 | Year 3 | Year 4 | Average Monthly |
January | 75 | 76 | 95 | 117 | 90.75 |
February | 48 | 34 | 34 | 52 | 42 |
March | 35 | 48 | 12 | 56 | 37.75 |
April | 22 | 34 | 35 | 25 | 29 |
May | 2 | 6 | 12 | 1 | 5.25 |
June | 3 | 5 | 2 | 10 | 5 |
July | 28 | 33 | 35 | 28 | 31 |
August | 145 | 98 | 109 | 120 | 118 |
September | 181 | 197 | 162 | 145 | 171.25 |
October | 190 | 201 | 220 | 180 | 197.75 |
November | 100 | 101 | 110 | 98 | 102.25 |
December | 81 | 70 | 87 | 88 | 81.5 |
Total | 910 | 903 | 913 | 920 |
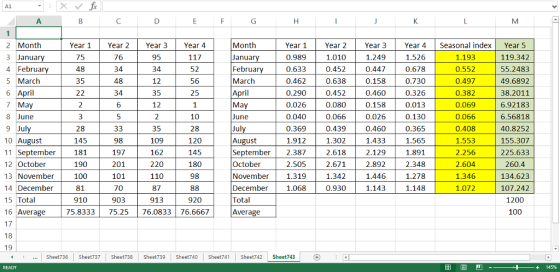
a. Suppose Block Commodities calculated a set of seasonal relatives to express this monthly variation in rock salt deliveries, using this set of data. What would the value of the seasonal relative for the month of each month?
b. Block Commodities believes that this year will be a busy year for rock salt deliveries, forecasting a total of 1,200 tons to be delivered during the year. Using this annual forecast and Block’s set of seasonal relatives, what would be a logical forecast for May of next year? What would be a logical forecast for October of next year?
Homework Answers
The seasonal relatives are shown in yellow. The forecast values are shown in green.
The method.
We have the historical data for the last 4 years and the months. Calculate the average monthly demand for each year. (B16 to E16)
Next, create a similar table with empty values. For each of the corresponding month of a year, divide the actual value by the average value to find the annual index. For example, March, Year 3 will have an annual index of 12/76.0833 = 0.158. Repeat this for all of them.
Next, determine the average value of annual indexes for across a month. For example, month of August the seasonal index will be (1.912+1.302+1.433+1.565)/4 = 1.553. Repeat this for all the months.
This will provide the seasonal index for the data set.
In the next step, we know the annual demand for year 5. Let’s find the average demand by dividing it by 12. Multiply this average demand with the seasonal index to obtain the monthly demand. (here the data is in decimals but you can round it to nearest integer).
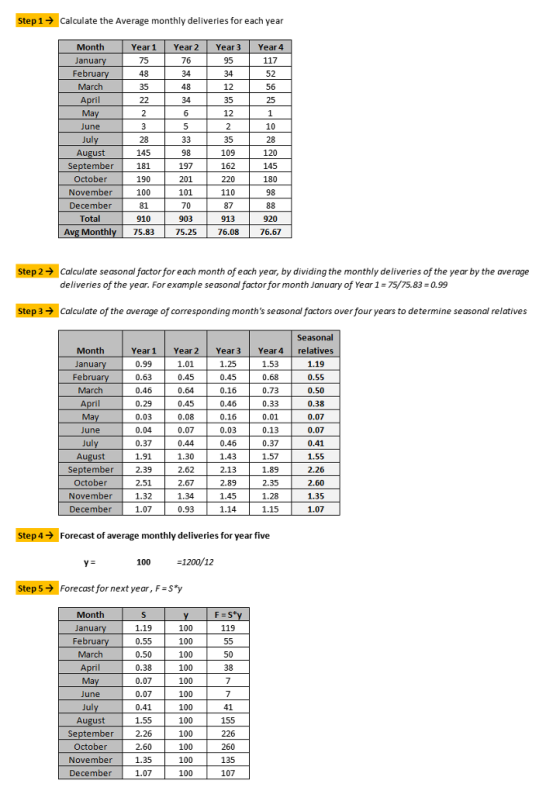
Logical forecast for May of next year = 7
Logical forecast for October of next year = 260
Add Answer to:
Block Commodities has gathered the following information concerning rock salt deliveries (tons) to its clients, which it believes are highly seasonal:
Most questions answered within 3 hours.
-
Two wave pulses travel on a string toward each other. The wave
pulses can be described...
asked 1 minute ago -
1.A solution has a pH of 5.5. What would be the color of the
solution if...
asked 14 minutes ago -
Over time, hydrogen peroxide, H2O2,
degrades into water and oxygen gas. A bottle of hydrogen
peroxide is...
asked 8 minutes ago -
2. Consider the following data table for a hypothetical
economy.
Aggregate
Consumption
Personal
&n
asked 13 minutes ago -
Adidas Runs Into Supply-Chain Problems in Crucial North
American Market
Shares fall amid concern the sporting-goods...
asked 14 minutes ago -
The physical plant at the main campus of a large state
university recieves daily requests to...
asked 53 minutes ago -
Determine the probability p(2) for a binomial
experiment with n=12 trials and the success probability
p=0.1....
asked 25 minutes ago -
What is the vapor pressure at 20 degrees C of an ideal solution
prepared by the...
asked 23 minutes ago -
You want to find the independent and dependent variables taken
from a sample of 30 dropouts....
asked 56 minutes ago -
. A light signal is traveling through a fiber. What is the delay
in the signal...
asked 45 minutes ago -
“Architects can have an important and direct impact on thermal
comfort and IAQ for improving design...
asked 29 minutes ago -
A 1.10 kg sample of a metal sample absorbs 43.5 kJ of heat,
resulting in a...
asked 53 minutes ago