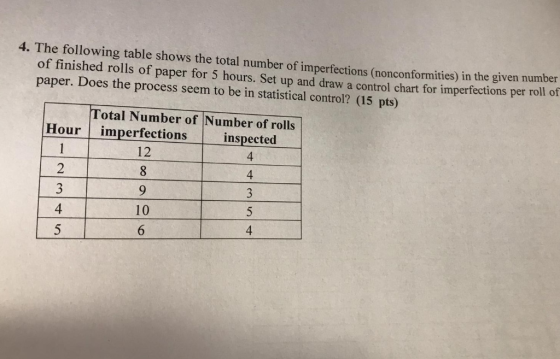
The following table shows the total number of imperfections (nonconformities) in the given number of finished rolls of paper for 5 hours. Set up and draw a control chart for imperfections per roll of paper. Does the process seem to be in statistical control?
Homework Answers

Add Answer to:
The following table shows the total number of imperfections
(nonconformities) in the given number of finished...
A paper mill uses a control chart to Data on Imperfections in Rolls of Paper monitor...
 A paper mill uses a control chart to Data on Imperfections in Rolls of Paper monitor the imperfection in finished Total Total Ils of paper. Production output is umber Number of Number Number of of Rolls Imper- Day Produced fections Day Produced fections inspected for twenty days, and the resulting data are shown here. Use these data to set up a control chart for 218 4 12 18 14 nonconformities per roll of paper. Does the process appear to be...
The data in the table below represents the number of nonconformities per 1000 meters in telephone cable. Using R languag...
 The data in the table below represents the number of
nonconformities per 1000 meters in telephone cable. Using R
language to analyze the data and determine: Is process in
statistical control? What control procedure would you recommend for
future production? Please include all necessary code and chart to
solve the problem.
Telephone Cable Data for Exercise 7.53 Number of Sample Number of Sample Number Nonconformities Number Nonconformities 13 15 15 16 17 10 18 19 13 20 0 21 19...
The data in the table below represents the number of
nonconformities per 1000 meters in telephone cable. Using R
language to analyze the data and determine: Is process in
statistical control? What control procedure would you recommend for
future production? Please include all necessary code and chart to
solve the problem.
Telephone Cable Data for Exercise 7.53 Number of Sample Number of Sample Number Nonconformities Number Nonconformities 13 15 15 16 17 10 18 19 13 20 0 21 19...
1) The following Table presents the number of nonconformities observed in 26 successive samples of 100...
 1) The following Table presents the number of nonconformities observed in 26 successive samples of 100 printed circuit boards. Note that, for reasons of convenience, the inspection unit is defined as 100 boards. Set up a c chart for these data and the revised c chart if needed. Number of Nonconformities Number of Nonconformities Sample Number Sample Number 10 17 19 10 12
The number of nonconformities found on final inspection of a CD deck is shown in Table...
The number of nonconformities found on final inspection of a CD deck is shown in Table below. a) Can you conclude that the process is in statistical control? b) What center line and control limits would you recommend for controlling future production? CD Deck Number Number of Nonconformities 1 0 2 1 3 1 4 0 5 2 6 1 7 1 8 3 9 2 10 1 11 0 12 3 13 2 14 5 15 1 16 2...
The U Chart versus the C Chart The C chart is used when a single unit...
 The U Chart versus the C Chart The C chart is used when a single
unit will be examined for nonconformities at each time point. The U
chart is used when a number of units will be sampled at each time
point, and a per unit average number of nonconformities will be
obtained. U Chart Formulas Suppose we have k samples, each of size
ni. Let Di represent the total number of nonconformities in the i
th sample. Formulas for...
The U Chart versus the C Chart The C chart is used when a single
unit will be examined for nonconformities at each time point. The U
chart is used when a number of units will be sampled at each time
point, and a per unit average number of nonconformities will be
obtained. U Chart Formulas Suppose we have k samples, each of size
ni. Let Di represent the total number of nonconformities in the i
th sample. Formulas for...
Scenario: Selma runs a pastry shop. The following table shows the total number of cupcakes produced...
 Scenario: Selma runs a pastry shop. The following table shows the total number of cupcakes produced as a function of the number of hours of labor put into making them. Hours of Labor 0 1 2 3 4 5 Cupcakes 0 10 25 35 44 52 58 Refer to the scenario above. At which hour of labor does Diminishing (Marginal) Returns first start? 2nd 6th 3rd 4th
Chapter 7 Table below contains data on examination of medical insurance claims. Every day 50 claims...
Chapter 7 Table below contains data on examination of medical insurance claims. Every day 50 claims were examined. Day Number Nonconforming 1 0 2 3 3 4 4 6 5 5 6 2 7 8 8 9 9 4 10 2 11 6 12 4 13 8 14 0 15 7 16 20 17 6 18 1 19 5 20 7 Set up the fraction nonconforming control chart (p-chart) for this process. Plot the preliminary data in the above table...
3) A supply chain engineering group monitors shipments of materials through the company distribution network. Errors...
 3) A supply chain engineering group monitors shipments of materials through the company distribution network. Errors on either the delivered material or the accompanying documentation are tracked on a weekly basis. Fifty randomly selected shipments are examined and the errors recorded. Data for twenty weeks are shown in Table. Set up a u control chart to monitor this process. Sample Number (week),i Sample Size, a Total Number of Errors Nonconformities!, Xy 50 50 50 50 50 5) 50 20
Question 4 Company JW produces large towels. They are supposed to be brightly colored and have a fringe on each end. A towel is selected from finished towels at regular intervals and subjected to...
 Question 4 Company JW produces large towels. They are supposed to be brightly colored and have a fringe on each end. A towel is selected from finished towels at regular intervals and subjected to intense inspection in search of any defects. A defect can be a hole, a missing fringe, a stain, a badly dyed spot, etc. Each occurrence counts as a distinct defect. Data on 12 sample towels are given in Table QB4 Towel2 3 4 5 6 79...
D5. Scenario: Selma runs a pastry shop. The following table shows the total number of cupcakes produced as a functi...
 D5. Scenario: Selma runs a pastry shop. The following table shows the total number of cupcakes produced as a function of the number of hours of labor put into making them. Hours of Labor Cupcakes 2 10 25 35 44 3 4 5 6 52 58 Refer to the scenario above. What is the marginal product of the third hour of labor? 10 cupcakes 35 cupcakes 25 cupcakes 8 cupcakes
 A paper mill uses a control chart to Data on Imperfections in Rolls of Paper monitor the imperfection in finished Total Total Ils of paper. Production output is umber Number of Number Number of of Rolls Imper- Day Produced fections Day Produced fections inspected for twenty days, and the resulting data are shown here. Use these data to set up a control chart for 218 4 12 18 14 nonconformities per roll of paper. Does the process appear to be...
 The data in the table below represents the number of
nonconformities per 1000 meters in telephone cable. Using R
language to analyze the data and determine: Is process in
statistical control? What control procedure would you recommend for
future production? Please include all necessary code and chart to
solve the problem.
Telephone Cable Data for Exercise 7.53 Number of Sample Number of Sample Number Nonconformities Number Nonconformities 13 15 15 16 17 10 18 19 13 20 0 21 19...
The data in the table below represents the number of
nonconformities per 1000 meters in telephone cable. Using R
language to analyze the data and determine: Is process in
statistical control? What control procedure would you recommend for
future production? Please include all necessary code and chart to
solve the problem.
Telephone Cable Data for Exercise 7.53 Number of Sample Number of Sample Number Nonconformities Number Nonconformities 13 15 15 16 17 10 18 19 13 20 0 21 19...
 1) The following Table presents the number of nonconformities observed in 26 successive samples of 100 printed circuit boards. Note that, for reasons of convenience, the inspection unit is defined as 100 boards. Set up a c chart for these data and the revised c chart if needed. Number of Nonconformities Number of Nonconformities Sample Number Sample Number 10 17 19 10 12
 The U Chart versus the C Chart The C chart is used when a single
unit will be examined for nonconformities at each time point. The U
chart is used when a number of units will be sampled at each time
point, and a per unit average number of nonconformities will be
obtained. U Chart Formulas Suppose we have k samples, each of size
ni. Let Di represent the total number of nonconformities in the i
th sample. Formulas for...
The U Chart versus the C Chart The C chart is used when a single
unit will be examined for nonconformities at each time point. The U
chart is used when a number of units will be sampled at each time
point, and a per unit average number of nonconformities will be
obtained. U Chart Formulas Suppose we have k samples, each of size
ni. Let Di represent the total number of nonconformities in the i
th sample. Formulas for...
 Scenario: Selma runs a pastry shop. The following table shows the total number of cupcakes produced as a function of the number of hours of labor put into making them. Hours of Labor 0 1 2 3 4 5 Cupcakes 0 10 25 35 44 52 58 Refer to the scenario above. At which hour of labor does Diminishing (Marginal) Returns first start? 2nd 6th 3rd 4th
 3) A supply chain engineering group monitors shipments of materials through the company distribution network. Errors on either the delivered material or the accompanying documentation are tracked on a weekly basis. Fifty randomly selected shipments are examined and the errors recorded. Data for twenty weeks are shown in Table. Set up a u control chart to monitor this process. Sample Number (week),i Sample Size, a Total Number of Errors Nonconformities!, Xy 50 50 50 50 50 5) 50 20
 Question 4 Company JW produces large towels. They are supposed to be brightly colored and have a fringe on each end. A towel is selected from finished towels at regular intervals and subjected to intense inspection in search of any defects. A defect can be a hole, a missing fringe, a stain, a badly dyed spot, etc. Each occurrence counts as a distinct defect. Data on 12 sample towels are given in Table QB4 Towel2 3 4 5 6 79...
 D5. Scenario: Selma runs a pastry shop. The following table shows the total number of cupcakes produced as a function of the number of hours of labor put into making them. Hours of Labor Cupcakes 2 10 25 35 44 3 4 5 6 52 58 Refer to the scenario above. What is the marginal product of the third hour of labor? 10 cupcakes 35 cupcakes 25 cupcakes 8 cupcakes
Most questions answered within 3 hours.
-
Under the influence of its drive force, a snowmobile is moving
at a constant velocity along...
asked 3 minutes ago -
What mechanisms Drive speciation??
(I.e. what was Dawins theory on the orgin of species, and how...
asked 1 hour ago -
The manager at a car assembly plant believes that the mean
assembly time for a car...
asked 2 hours ago -
Which of the following is true of electron capture?
A) It decreases the nuclide's mass number...
asked 3 hours ago -
Assuming an efficiency of 43.10%, calculate the actual yield of
magnesium nitrate formed from 114.9 g...
asked 4 hours ago -
The highly pathogenic bacterium Clostridium
perfringens causes gangrene, a disease that results in the
destruction of...
asked 6 hours ago -
In the context of situation analysis, which of the following is
a category for analysis in...
asked 6 hours ago -
In a study of the gas phase decomposition of sulfuryl chloride
at 600 K SO2Cl2(g)SO2(g) +...
asked 6 hours ago -
75 g of 2-propanol (C3H8O) and 25 g of pentane are mixed in a
200 mL...
asked 6 hours ago -
The 2800-turn coil in a dc motor has an area per turn of 1.1 ×
10-2...
asked 6 hours ago -
Draw a combinational logic circuit diagram with a symbol inside
the box for two I/P of...
asked 6 hours ago -
The cliché we use quite a lot in finance is: there is a need to
maximize...
asked 6 hours ago