
Homework Answers
ANSWERS:
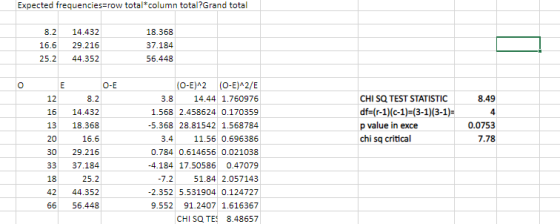
answer(B)
Test statistic:8.49
d.f=4
p-value=0.0753
critical value=7.78
Add Answer to:
Is HDTV ownership related to quantity of purchases of other electronics? A Best Buy retail outlet...
Please state your hypotheses, test statistic, pvalue and make a definitive conclusion statement. Please show all...
 Please state your hypotheses,
test statistic, pvalue and make a definitive conclusion
statement.
Please show all your work for my understanding! Thank you so
much
15.4 Is HDTV ownership related to quantity of purchases of other electronics? A Best Buy retail outlet collected the following data for a random sample of its recent customers. Research question: At a = .10, is the frequency of in-store purchases independent of the number of large-screen HDTVs owned (defined as 50 inches or more)?...
Please state your hypotheses,
test statistic, pvalue and make a definitive conclusion
statement.
Please show all your work for my understanding! Thank you so
much
15.4 Is HDTV ownership related to quantity of purchases of other electronics? A Best Buy retail outlet collected the following data for a random sample of its recent customers. Research question: At a = .10, is the frequency of in-store purchases independent of the number of large-screen HDTVs owned (defined as 50 inches or more)?...
Sixty-four students in an introductory college economics class were asked how many credits they had earned...
Sixty-four students in an introductory college economics class were asked how many credits they had earned in college, and how certain they were about their choice of major. At α = .02, is the degree of certainty independent of credits earned? Credits Earned Very Uncertain Somewhat Certain Very Certain Row Total 0 – 9 15 7 2 24 10 – 59 10 5 6 21 60 or more 4 10 14 28 Col Total 29 22 22 73 Click here...
PRI NIER VERSION BACK NEXI Chapter 7, Section 1, Exercise 006 The categories of a categorical...
 PRI NIER VERSION BACK NEXI Chapter 7, Section 1, Exercise 006 The categories of a categorical variable are given along with the observed counts from a sample. The expected counts from a null hypothesis are given in parentheses. Compute the x-test statistic, and use the x-distribution to find the p-value of the test. Category Observed 59 (50) 31 (50) 60 (50) Round your answer for the chi-square statistic to two decimal places, and your answer for the p-value to four...
From 89 of its restaurants, Noodles & Company managers collected data on per-person sales and the...
From 89 of its restaurants, Noodles & Company managers collected data on per-person sales and the percent of sales due to "potstickers" (a popular food item). Both numerical variables failed tests for normality, so they tried a chi-square test. Each variable was converted into ordinal categories (low, medium, high) using cutoff points that produced roughly equal group sizes. At α= .10, is per-person spending independent of percent of sales from potstickers? Potsticker % of Sales Per-Person Spending Low Medium High...
A researcher is interested in investigating whether living situation and pet ownership are dependent. The table...
 A researcher is interested in investigating whether living situation and pet ownership are dependent. The table below shows the results of a survey. Frequencies of Living Situation and Pet Single Family Couple 85 81 93 Cat 116 70 90 Various 37 51 46 None 53 53 32 What can be concluded at the a=0.10 significance level? Dog a. What is the correct statistical test to use? Goodness-of-Fit Independence Homogeneity Paired t-test b. What are the null and alternative hypotheses? HO:...
A researcher is interested in investigating whether living situation and pet ownership are dependent. The table...
 A researcher is interested in investigating whether living situation and pet ownership are dependent. The table below shows the results of a survey. Frequencies of Living Situation and Pet Single Family Couple Dog 85 81 93 Cat 116 70 90 Various 37 51 46 None 53 53 32 What can be concluded at the a = 0.10 significance level? a. What is the correct statistical test to use? Goodness-of-Fit Independence Homogeneity Paired t-test b. What are the null and alternative...
(If any are cut off answer what you can see) 3A) 3b) 3C) 3D) You are...
 (If any are cut off answer what you can see)
3A)
3b)
3C)
3D)
You are conducting a multinomial Goodness of Fit hypothesis test for the claim that the 4 categories occur with the following frequencies: H:PA = 0.25; PB = 0.4; Pc = 0.1; PD 0.25 Complete the table. Report all answers accurate to three decimal places. Observed Expected Category Residual Frequency Frequency А 17 B 57 с 8 D 23 What is the chi-square test-statistic for this data?...
(If any are cut off answer what you can see)
3A)
3b)
3C)
3D)
You are conducting a multinomial Goodness of Fit hypothesis test for the claim that the 4 categories occur with the following frequencies: H:PA = 0.25; PB = 0.4; Pc = 0.1; PD 0.25 Complete the table. Report all answers accurate to three decimal places. Observed Expected Category Residual Frequency Frequency А 17 B 57 с 8 D 23 What is the chi-square test-statistic for this data?...
(If some are cut off just answer what you can see) 2A) 2B) 2C) 2D) You...
 (If some are cut off just answer what you can see)
2A)
2B)
2C)
2D)
You are conducting a multinomial hypothesis test (a = 0.05) for the claim that all 5 categories are equally likely to be selected. Complete the table. Observed Expected Squared Category Pearson Frequency Frequency Residual A 25 B 14 с 9 D 22 E 20 Report all answers accurate to three decimal places. But retain unrounded numbers for future calculations. What is the chi-square test-statistic for...
(If some are cut off just answer what you can see)
2A)
2B)
2C)
2D)
You are conducting a multinomial hypothesis test (a = 0.05) for the claim that all 5 categories are equally likely to be selected. Complete the table. Observed Expected Squared Category Pearson Frequency Frequency Residual A 25 B 14 с 9 D 22 E 20 Report all answers accurate to three decimal places. But retain unrounded numbers for future calculations. What is the chi-square test-statistic for...
A researcher is interested in investigating whether living situation and pet ownership are dependent. The table...
A researcher is interested in investigating whether living situation and pet ownership are dependent. The table below shows the results of a survey. Frequencies of Living Situation and Pet Single Family Couple Dog 90 90 78 Cat 102 79 93 Various 32 58 49 None 53 47 35 What can be concluded at the αα = 0.10 significance level? What is the correct statistical test to use? Goodness-of-Fit Independence Paired t-test Homogeneity What are the null and alternative hypotheses? H0:...
A researcher is interested in investigating whether living situation and pet ownership are dependent. The table...
 A researcher is interested in investigating whether living situation and pet ownership are dependent. The table below shows the results of a survey. Frequencies of Living Situation and Pet Single Family Couple Dog 85 84 77 Cat 98 94 67 Various 33 54 52 None 51 56 55 What can be concluded at the a = 0.10 significance level? a. What is the correct statistical test to use? Paired t-test O Independence Goodness-of-Fit Homogeneity b. What are the null and...
 Please state your hypotheses,
test statistic, pvalue and make a definitive conclusion
statement.
Please show all your work for my understanding! Thank you so
much
15.4 Is HDTV ownership related to quantity of purchases of other electronics? A Best Buy retail outlet collected the following data for a random sample of its recent customers. Research question: At a = .10, is the frequency of in-store purchases independent of the number of large-screen HDTVs owned (defined as 50 inches or more)?...
Please state your hypotheses,
test statistic, pvalue and make a definitive conclusion
statement.
Please show all your work for my understanding! Thank you so
much
15.4 Is HDTV ownership related to quantity of purchases of other electronics? A Best Buy retail outlet collected the following data for a random sample of its recent customers. Research question: At a = .10, is the frequency of in-store purchases independent of the number of large-screen HDTVs owned (defined as 50 inches or more)?...
 PRI NIER VERSION BACK NEXI Chapter 7, Section 1, Exercise 006 The categories of a categorical variable are given along with the observed counts from a sample. The expected counts from a null hypothesis are given in parentheses. Compute the x-test statistic, and use the x-distribution to find the p-value of the test. Category Observed 59 (50) 31 (50) 60 (50) Round your answer for the chi-square statistic to two decimal places, and your answer for the p-value to four...
 A researcher is interested in investigating whether living situation and pet ownership are dependent. The table below shows the results of a survey. Frequencies of Living Situation and Pet Single Family Couple 85 81 93 Cat 116 70 90 Various 37 51 46 None 53 53 32 What can be concluded at the a=0.10 significance level? Dog a. What is the correct statistical test to use? Goodness-of-Fit Independence Homogeneity Paired t-test b. What are the null and alternative hypotheses? HO:...
 A researcher is interested in investigating whether living situation and pet ownership are dependent. The table below shows the results of a survey. Frequencies of Living Situation and Pet Single Family Couple Dog 85 81 93 Cat 116 70 90 Various 37 51 46 None 53 53 32 What can be concluded at the a = 0.10 significance level? a. What is the correct statistical test to use? Goodness-of-Fit Independence Homogeneity Paired t-test b. What are the null and alternative...
 (If any are cut off answer what you can see)
3A)
3b)
3C)
3D)
You are conducting a multinomial Goodness of Fit hypothesis test for the claim that the 4 categories occur with the following frequencies: H:PA = 0.25; PB = 0.4; Pc = 0.1; PD 0.25 Complete the table. Report all answers accurate to three decimal places. Observed Expected Category Residual Frequency Frequency А 17 B 57 с 8 D 23 What is the chi-square test-statistic for this data?...
(If any are cut off answer what you can see)
3A)
3b)
3C)
3D)
You are conducting a multinomial Goodness of Fit hypothesis test for the claim that the 4 categories occur with the following frequencies: H:PA = 0.25; PB = 0.4; Pc = 0.1; PD 0.25 Complete the table. Report all answers accurate to three decimal places. Observed Expected Category Residual Frequency Frequency А 17 B 57 с 8 D 23 What is the chi-square test-statistic for this data?...
 (If some are cut off just answer what you can see)
2A)
2B)
2C)
2D)
You are conducting a multinomial hypothesis test (a = 0.05) for the claim that all 5 categories are equally likely to be selected. Complete the table. Observed Expected Squared Category Pearson Frequency Frequency Residual A 25 B 14 с 9 D 22 E 20 Report all answers accurate to three decimal places. But retain unrounded numbers for future calculations. What is the chi-square test-statistic for...
(If some are cut off just answer what you can see)
2A)
2B)
2C)
2D)
You are conducting a multinomial hypothesis test (a = 0.05) for the claim that all 5 categories are equally likely to be selected. Complete the table. Observed Expected Squared Category Pearson Frequency Frequency Residual A 25 B 14 с 9 D 22 E 20 Report all answers accurate to three decimal places. But retain unrounded numbers for future calculations. What is the chi-square test-statistic for...
 A researcher is interested in investigating whether living situation and pet ownership are dependent. The table below shows the results of a survey. Frequencies of Living Situation and Pet Single Family Couple Dog 85 84 77 Cat 98 94 67 Various 33 54 52 None 51 56 55 What can be concluded at the a = 0.10 significance level? a. What is the correct statistical test to use? Paired t-test O Independence Goodness-of-Fit Homogeneity b. What are the null and...
Most questions answered within 3 hours.
-
An entomologist discovers a dung beetle rolling a ball of dung
along the ground, and decides...
asked 40 minutes ago -
Humans have used horses for transportation for millions of
years. Therefore, they will use horses for...
asked 2 hours ago -
The following are the Jensen Corporation's unit costs of making
and selling an item at a...
asked 3 hours ago -
Does direct Medicare reimbursement of Advanced practice nurses
increase access to their services?
asked 3 hours ago -
List and explain why a company would choose to use a
published
compensation survey vs. creating...
asked 4 hours ago -
A discrete random variable X can take values from 1 to 10. Find
the variance of...
asked 4 hours ago -
The primary financial goal of a corporation is to maximize:
shareholders wealth.
earnings per share.
stock...
asked 4 hours ago -
determine whether the vectors u=(1,2,3,), v=(-2,1,0) and
w=(1,0,1) are linearly dependent or independent.
asked 4 hours ago -
python
Define a function called print_values which takes a dictionary
object as a parameter. The function...
asked 5 hours ago -
In Chapter 1 you created a program named Triangle in
which you displayed a seven-line triangle...
asked 5 hours ago -
Research question: What are the differences between separately
stated and non separately stated transactions in an...
asked 5 hours ago -
By using Arduino write a code that connects two LEDs to two
push-buttons. Each button controls...
asked 6 hours ago